
December 14, 2020

Jerry Jensen
Improving Waterflood Efficiency and Increasing Oil Production
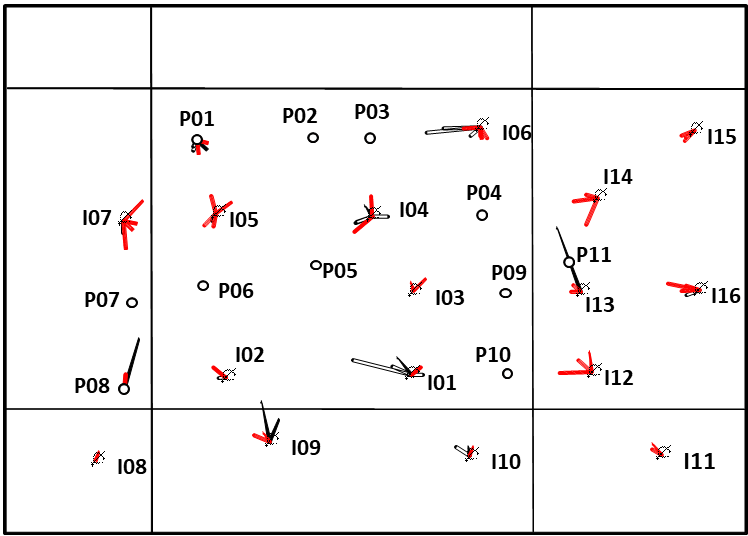
Waterflood connectivity map for 16 injection and 11 production wells. Black arrows indicate above-normal connectivity and red arrows indicate below-normal connectivity. The length of the arrow indicates the degree above or below normal. Eastern injectors I12, I14, and I16 are in a less-connected part of the field, whereas injectors I01 and I06 are in better-connected locations. These results are consistent with the field’s geological information.
Any rural Texas resident with a cell phone is familiar with connectivity issues. In some ways, oilfield operators have a similar problem. When they inject water to produce more oil, they want the water to sweep the oil to the producer wells. This process requires reservoir connectivity: there need to be pathways that will conduct the water towards the producers. One difference with the cell phone analogy, however, is that too much connectivity can be as bad as too little connectivity for waterfloods. For example, too much connectivity leads to water bypassing the oil on its way to the producer wells.
The STARR program is working to develop and apply methods for Texas operators to measure oilfield connectivity. This information can help them adjust injection rates and identify favorable locations for new wells (see figure). Major practical challenges for determining connectivity include coping with: 1) old fields where injection and production rates may be missing and 2) fields where the waterflood was implemented on a piecemeal basis. Importantly, it provides small field operators—who may not have the resources to create and use complicated reservoir models—with a way to improve waterflood management to reduce unnecessary water production and recover more oil.

Iulia Olariu
High-frequency Sequence Stratigraphy of Early Miocene Deltaic shorelines, Offshore Texas and Louisiana
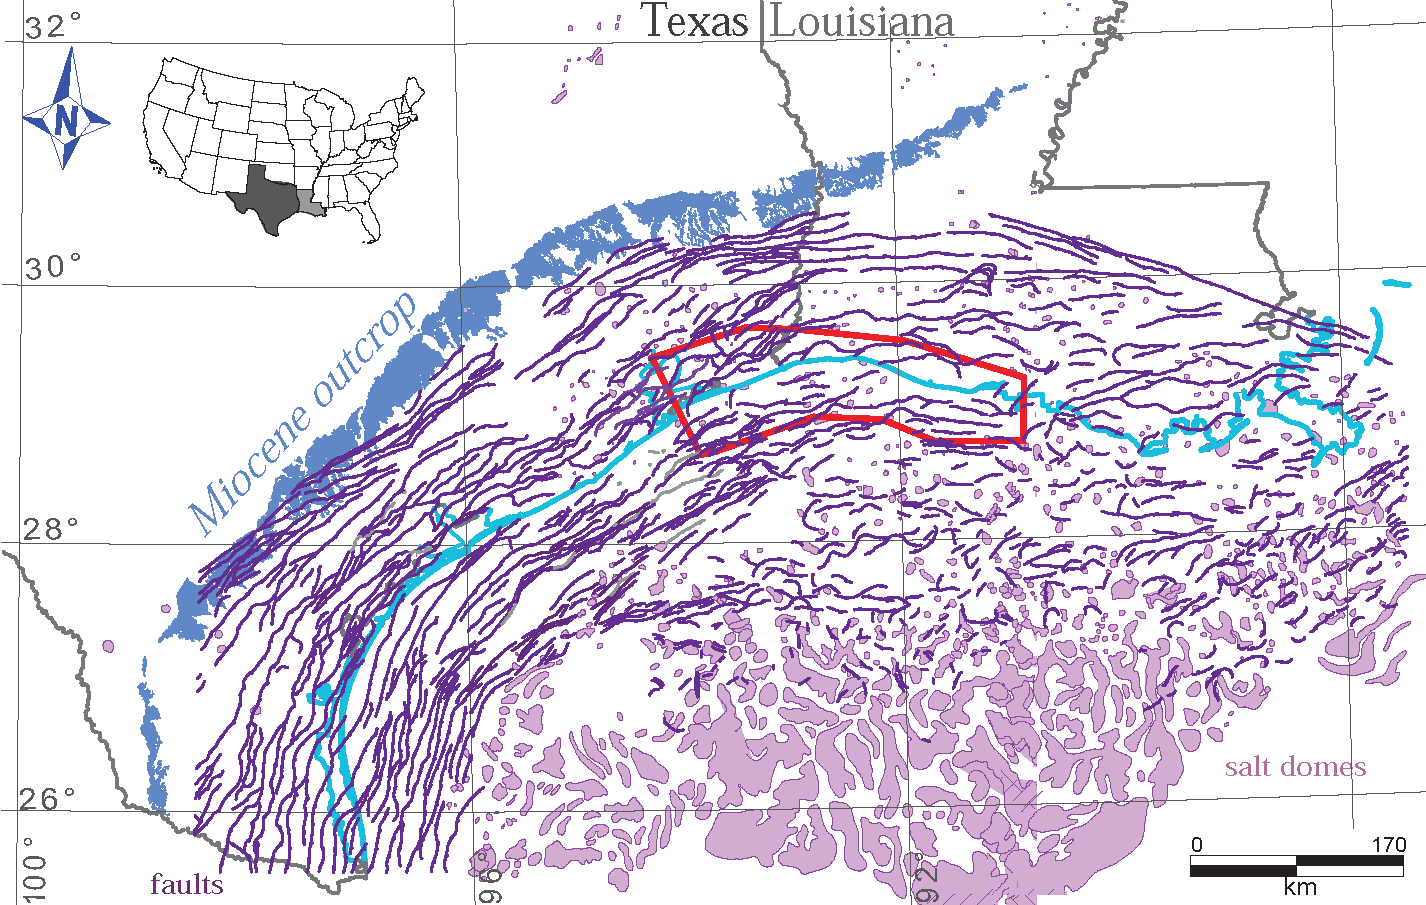
Well logs and 3D seismic reflection data are integrated to image Lower Miocene depocenters of the upper Texas and westernmost Louisiana coastal and offshore areas. Although previously interpreted at a large scale (3rd-order cycles), the detailed stratigraphy and depositional history of the early Miocene succession has not been fully developed. The lower Miocene interval from Robulus L to Amphistegina B has been subdivided into five 4th order cycles to provide finer scale stratigraphic detail and interpretation of depositional environments.
Results of the finer scale correlations are presented in a series of sandstone percent maps. Overall, the maps display a strike-elongate (sub-parallel to the present-day coastline) orientation for the sandstone bodies which thin to the southeast (basinward). Net sandstone thickness is relatively low in older cycles and increases in younger cycles, suggesting an overall progradation of the deltaic system into the mapped area through time. Continued marine regression and southward movement of the shoreline are also confirmed by seismic amplitude maps. After a major transgression associated with Robulus L deltaic progradation occurred under rising sea level conditions. Deltaic sediments prograded southward and sandstone brought to the upper Texas coast was distributed laterally by longshore currents to form strandplain coastlines. Two deltaic depocenters are centered in High Island area offshore Texas during the maximum regression. Sandstone progressively decreases laterally to the east in Louisiana where more shale is present and marine processes rework deltaic derived sandstones into shore parallel bars. The deltaic system moves landward during the youngest cycle marking the beginning of marine transgression associated with Amphistegina B.
Detailed stratigraphic interpretation shows more variability in the dominant shoreline processes during early Miocene than previously thought. Recognition of sedimentary systems variability at a 4th order scale is critical for improved hydrocarbon exploration and in understanding potential future CO2 storage in the area.

