
June 22, 2020

Aaron Averett
Delivering Insights with Interactive Maps
At the Bureau of Economic Geology, the target audience for our work is often not other scientists, but industry, government officials, or members of the public. In these cases, we need to use more approachable means of delivering insights than scholarly journals. One such method is the use of interactive maps, which allow scientists to visually and graphically present the results of our research or data collection.
Interactive maps are commonplace, even expected, in many fields as a means of presenting inherently geographic data to customers or other stakeholders to inform their decision-making. At the Bureau, we use this technology to disseminate the results of our work to industry and members of the public in particular. Each application is custom made for its specific purpose. Some simply present data, whereas others are capable of receiving user input, performing complex calculations based that input, and presenting the results.
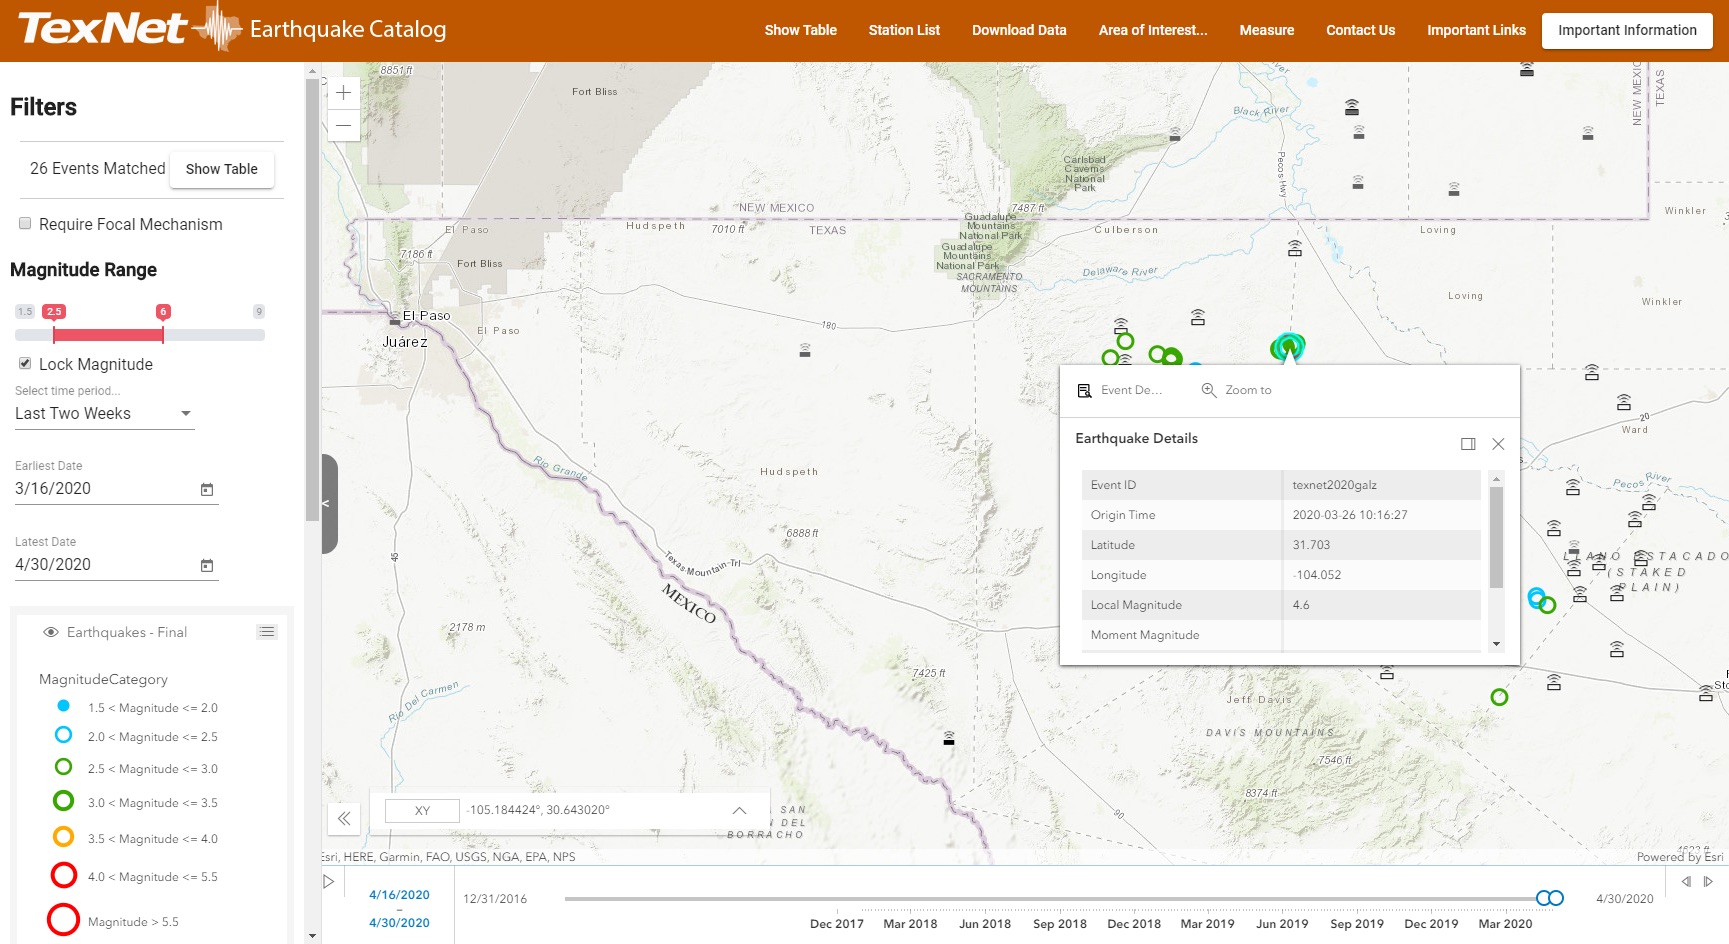
One example of this technology is the TexNet Earthquake Catalog, TexNet’s web-accessible interactive map, which is able to rapidly present a user with information on detected earthquakes based on a number of user-controlled filters. This application has allowed Bureau researchers to publish data about earthquakes almost as soon as they are detected.

Dr. Esti Ukar
SEM-CL Imaging of Carbonate Cements and the Applications for Structural Diagenesis
Understanding the interaction between diagenetic processes that act during deformation, or structural diagenesis, is key for a variety of applications such as hydrocarbon exploration, groundwater flow, and CO₂ sequestration. Cements precipitated in fractures and the fluid inclusions trapped within them provide a means to do so by recording information about temperature, pressure, stress, fluid composition, and timing and rates of deformation.
High-resolution imaging techniques, especially scanning electron microscope-based cathodoluminescence (SEM-CL), can reveal subtle differences in trace element composition and crystal structure, allowing scientists to unravel the history of these cements. In quartz, SEM-CL has been effective at imaging microfractures, crystal growth zoning, crack-seal textures, and crosscutting relationships. However, phosphorescence in calcite has hindered high-resolution CL imaging to the same level that has been possible for quartz.
Recent advances in SEM techniques have overcome such imaging impediments and have served to unravel microstructures in carbonate cements similar to those previously observed in quartz. Advances in delineating textures in widespread carbonate mineral deposits have provided evidence for growth and occlusion of fracture porosity.
Because carbonates are the most common types of cements in fractures within mudrocks, carbonate rocks, and lithic- and/or carbonate-rich sandstones deformed under diagenetic conditions, these recent developments provide us with the opportunity to advance our knowledge of the development and evolution of naturally fractured carbonate rocks.
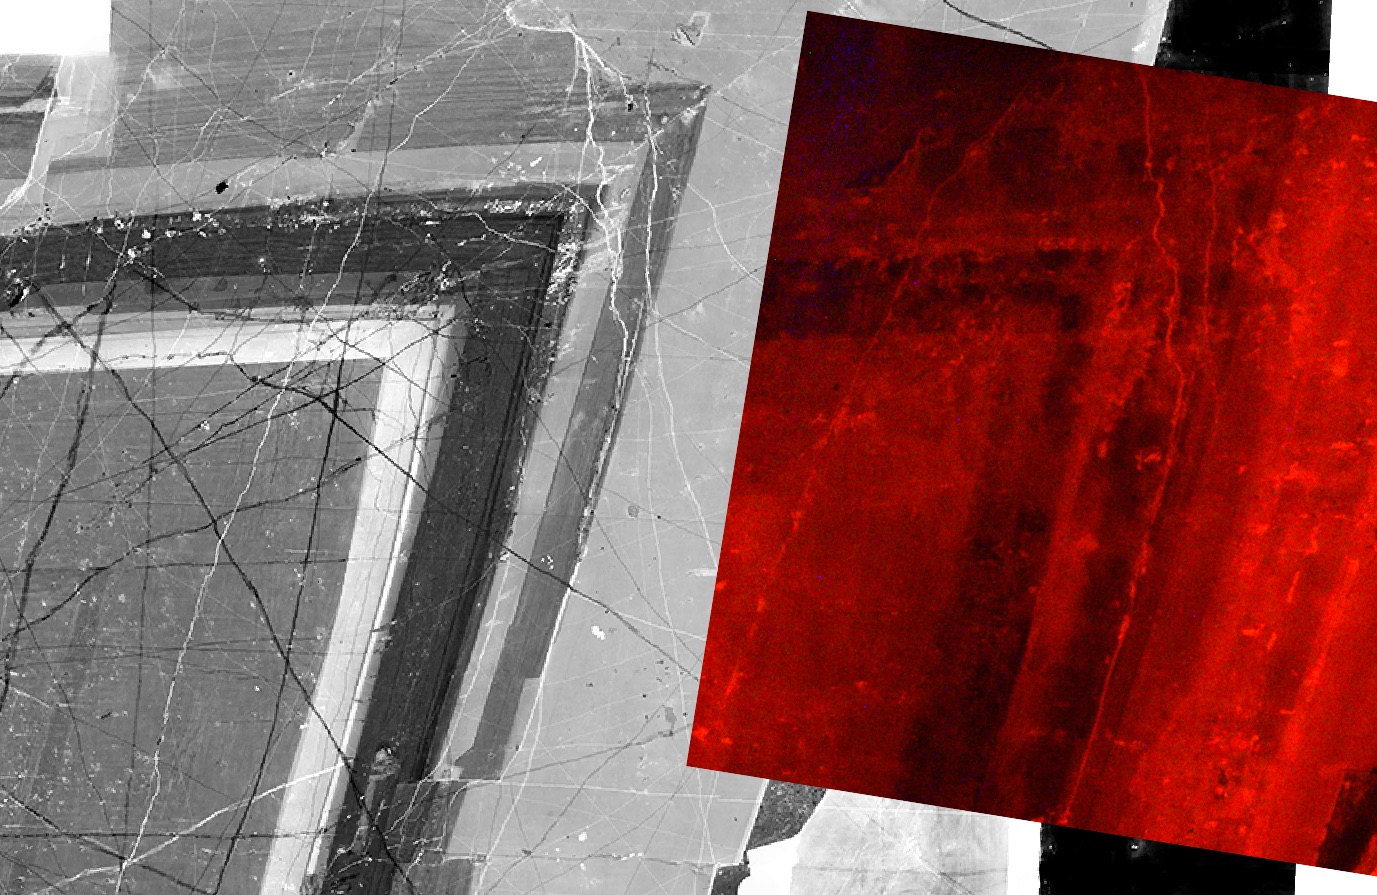
Cathodoluminescence of a zoned dolomite crystal filling a cavity in a Knox Group solution-collapse breccia. On the left, a SEM-CL photomosaic shows fine growth zoning and multiple generations (different shades of grey) of microfractures, especially in the core of the crystal. On the right, a traditional optical-CL image of the same area shows dolomite growth zones and microfractures at lower resolution (image courtesy of Thomas Quintero).

