Matagorda Bay to San Antonio Bay
STATUS AND TRENDS OF INLAND WETLAND AND AQUATIC HABITATS
The study area encompasses Matagorda Island, Matagorda Peninsula, and the Colorado River Delta, an area that is located within Matagorda and Calhoun Counties along the central Texas coast. Matagorda Island is a broad accretionary barrier island with well-developed fore-island dunes, extensive back-island estuarine marshes, and numerous relict beach ridges and intervening swales that are the sites of palustrine marshes in the central part of the island. In contrast is Matagorda Peninsula, a much narrower barrier that is undergoing erosion along much of its length and is characterized by numerous hurricane washover channels. Back-island estuarine marshes are important components of the peninsula. Connecting Matagorda Peninsula to the mainland is the Colorado River Delta, an elongate delta that separates East Matagorda Bay from Matagorda Bay and is the site of an extensive estuarine marsh complex. Although marshes on the east side of the delta are undergoing erosion, marshes on the west side are expanding, in part, along the dredged diversion channel that directs river flow to the west into Matagorda Bay.
Status, 2001
Major estuarine and palustrine habitats in the study area include salt, brackish, and fresh marshes, tidal flats, seagrass beds, and mangroves. Areas of estuarine open water are also important components of the salt and brackish marsh complex. The primary habitat mapped in the marine system is the Gulf beach, which consists of a topographically lower fore beach and a higher, less frequently flooded backbeach.
In 2001, wetland and aquatic habitats (excluding open water) were dominated by estuarine marshes, with a total area of 11,257 ha (27,793 acres), followed by seagrass beds totaling 4,607 ha (11,374 acres), and tidal flats at 2,289 ha (5,652 acres). Palustrine marshes (including ponds) had a total area of 857 ha (2,117 acres), and wetland scrub/shrub wetlands (primarily mangroves) 112 ha (276 acres). Along the Gulf shoreline, the area of mapped beaches totaled 1,124 ha (2,774 acres).
Trends
From the 1950’s through 2001 within the study area, some wetland classes underwent substantial net losses and gains, while others remained more stable (Table 1; Fig. 1 & 2). In general, estuarine marshes increased in total area during each period (1950’s–1979 and 1979–2001), with a total net gain of 506 ha (1,248 acres) from the 1950’s through 2001. Approximately 65 percent of this gain occurred from the 1950’s through 1979, indicating that the rate of gain decreased from 1979 through 2001. The average rate of marsh gain during the earlier period was about 14 ha/yr (34 acres/yr) and for the more recent period, about 9 ha/yr (21 acres/yr). The most extensive losses in habitats occurred in tidal flats, which underwent a systematic net decline from the 1950’s through 2001. Total area of tidal flats decreased by 1,188 ha (2,933 acres) during the earlier period (1950’s–1979) and 654 ha (1,614 acres) during the later period (1979–2001). Seagrass beds decreased in total area by about 830 ha (2,048 acres) from the 1950’s through 1979 but increased in area by a larger amount 915 ha (2,259 acres) from 1979 through 2001, for a net increase of 85 ha (211 acres) since the 1950’s. Palustrine marshes had their largest distribution in 1979, at 1,991 ha (4,915 acres), and lowest in 2001, at 857 ha (2,117 acres) (Table 1). The total area of mapped mangroves was slightly larger in 1979 than in 2001, indicating a net loss of 31 ha (77 acres) (this habitat was not mapped on the 1950’s b&w photographs). Finally, there was a net decline in the mapped area of Gulf beaches, decreasing in total area by 730 ha (1,803 acres) from the 1950’s thorough 1979 and 308 ha (760 acres) from 1979 through 2001, a net change of almost 50 percent since the 1950’s.
|
Habitat |
1950's |
1979 |
2001 |
|||
|
|
(ha) |
(acres) |
(ha) |
(acres) |
(ha) |
(acres) |
|
|
|
|
|
|
|
|
|
Estuarine marsh |
10,751 |
26,545 |
11,069 |
27,329 |
11,257 |
27,793 |
|
Tidal flat |
4,131 |
10,199 |
2,943 |
7,266 |
2,289 |
5,652 |
|
Seagrass bed |
4,521 |
11,163 |
3,692 |
9,115 |
4,607 |
11,374 |
|
Palustrine marsh |
996 |
2,458 |
1,991 |
4,915 |
857 |
2,117 |
|
Mangrove |
Not mapped |
- |
143 |
353 |
112 |
276 |
|
Gulf beach |
2,162 |
5,337 |
1,431 |
3,534 |
1,124 |
2,774 |
Table 1. Total area of major habitats in the1950’s, 1979 and 2001 in study area.
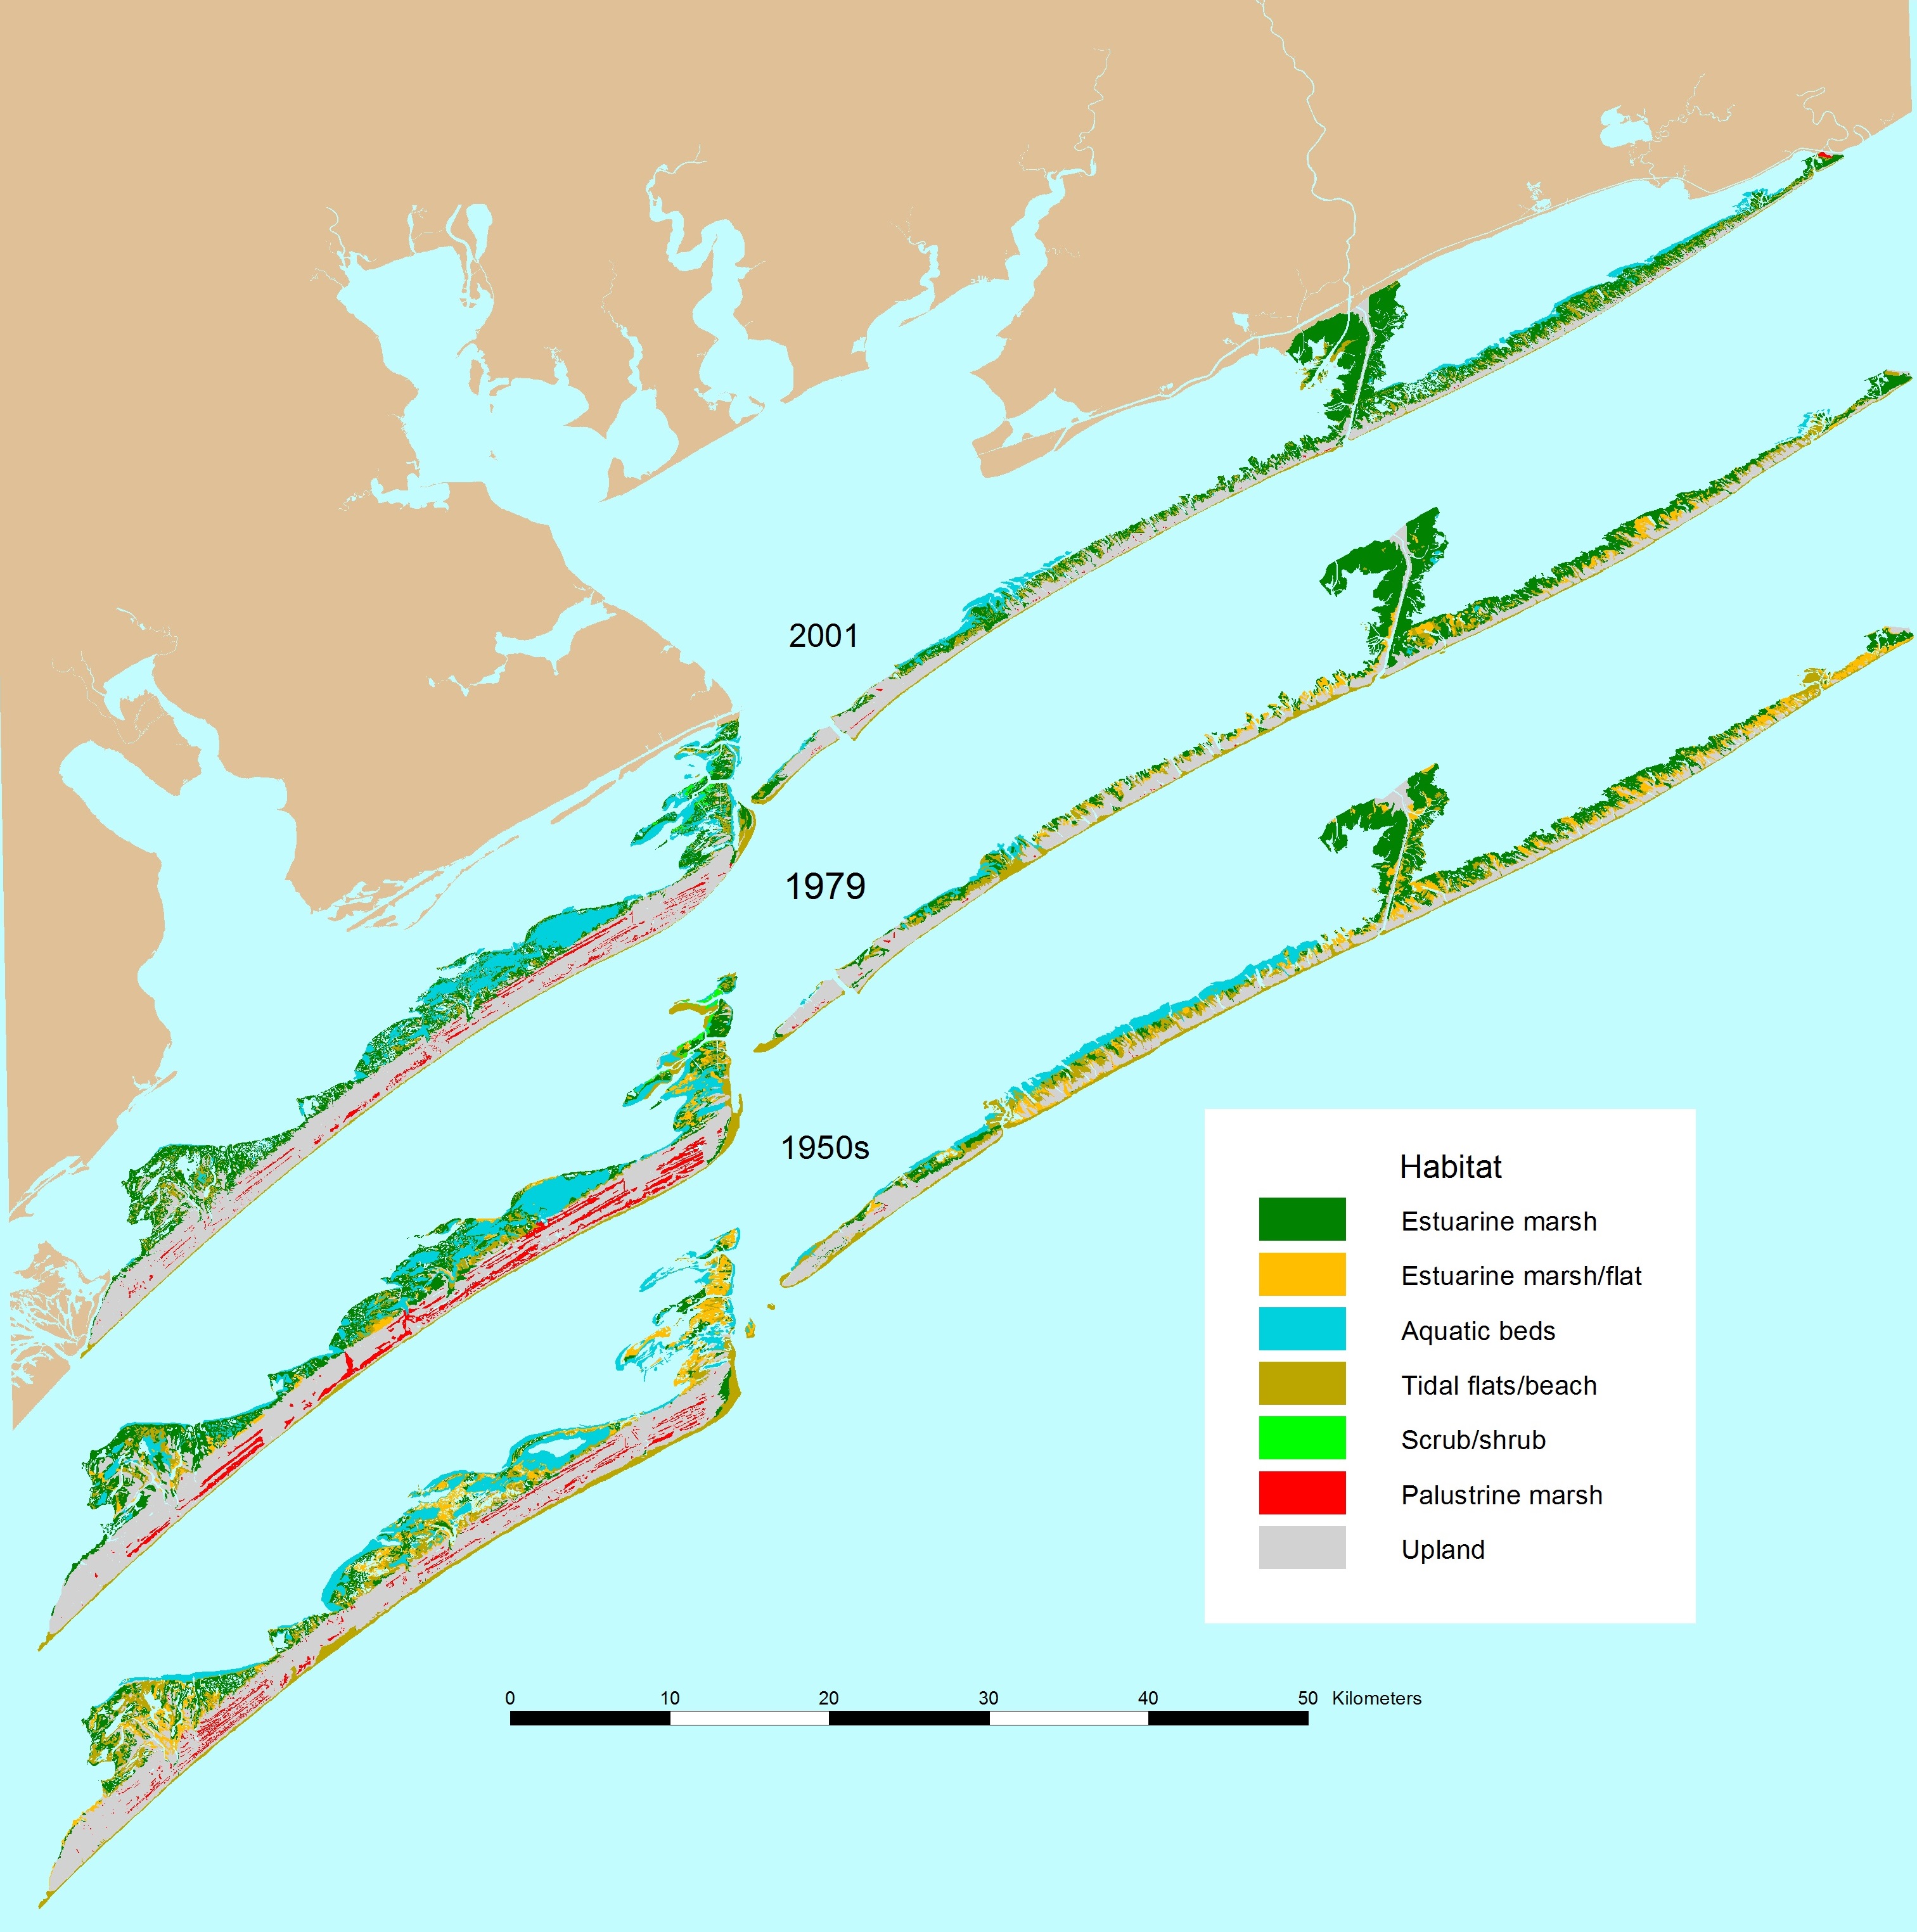
Figure 1. Map showing distribution of major wetland and aquatic habitats in 2001, 1979 and the 1950’s in the study area.
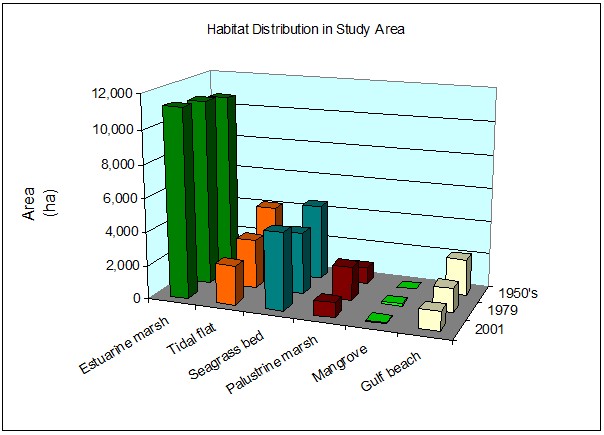
Figure 2. Areal distribution of major habitats in the study area in the 1950’s, 1979, and 2001.