Coastal Bend Area
STATUS AND TRENDS OF INLAND WETLAND AND AQUATIC HABITATS
This report presents results of an investigation to determine current status and historical trends of wetlands and associated aquatic habitats along south-central Texas barrier islands from Mesquite Bay to north Laguna Madre. The study area encompasses San José Island, Harbor Island, Mustang Island, and north Padre Island, an area that is located within Aransas, Nueces, and Kleberg Counties. San José Island is a broad accretionary barrier island with well-developed fore-island dunes, extensive back-island estuarine marshes, and numerous relict beach ridges and intervening swales that are the sites of palustrine marshes in the central part of the island; it has broad flood-tidal delta/washover fan complexes on its northeastern end. In contrast are Mustang Island and north Padre Island where eolian processes have erased most traces of accretionary features on the islands. Back-island estuarine marshes are important components of the islands, particularly at the bayward end of hurricane washover channels. Between and landward of San José and Mustang Islands is Harbor Island, a flood-tidal delta complex at the bayward mouth of the tidal inlet, Aransas Pass. Harbor Island is the site of extensive black mangroves and seagrasses.
Status, 2002-04
Major estuarine and palustrine habitats in the study area include salt, brackish, and fresh marshes; tidal flats; seagrass beds; and mangroves. Areas of estuarine open water are also important components of the salt and brackish-marsh complex. The primary habitat mapped in the marine system is the Gulf beach, which consists of a topographically lower forebeach and a higher, less frequently flooded backbeach.
In 2002–04 in the study area, wetland and aquatic habitats (excluding open water) were dominated by seagrass beds with a total area of 8,357 ha (20,650 acres), followed by tidal flats totaling 6,121 ha (15,125 acres) and estuarine marsh at 4,009 ha (9,906 acres). Scrub/shrub wetlands (primarily mangroves) had a total area of 837 ha (2,068 acres), and palustrine marshes (including ponds and flats) had an area of 767 ha (1,895 acres). Along the Gulf shoreline, the area of mapped beaches totaled 535 ha (1,322 acres).
Trends
From the 1950’s through 2002–04 within the study area, some wetland classes underwent substantial net losses and gains, whereas others remained more stable (Table 1; Fig 1 & 2). In general, estuarine marshes increased in total area during each period (1950’s–1979 and 1979–2002–04), with a total net gain of 2,246 ha (5,550 acres) from the 1950’s through 2002–04. Approximately 60% of this gain occurred from the 1950’s through 1979, indicating that the rate of gain decreased from 1979 through 2002–04. The average rate of marsh gain during the earlier period was about 58 ha/yr (142 acres/yr) and for the more recent period, about 38 ha/yr (95 acres/yr). Combining mangroves with marshes to create a marsh-mangrove habitat, the average rates of gain through time are 86 ha/yr (214 acres/yr) and 46 ha/yr (113 acres/yr) for the early and later periods, respectively.
The most extensive losses in habitats occurred in tidal flats, which underwent a major
net decline from the 1950’s through 1979 (Fig. IV). Total area of tidal flats decreased by 7,533 ha (18,613 acres) during this period (1950’s–1979). During the later period (1979–2002–04), the total area of tidal flats remained rather stable with a net gain of 7 ha (16 acres). Seagrass beds increased in total area by 3,537 ha (8,739 acres) from the 1950’s through 1979 and also increased from 1979 through 2002–04, but at a much smaller amount (694 ha; 1,715 acres). Palustrine habitats had their largest distribution
in 1979, at 890 ha (2,199 acres), and lowest in the 1950’s at 665 ha (1,643 acres)
(Table 1). The total area of mapped mangroves was slightly larger in 2002–04 than in 1979, indicating a net gain of 173 ha (426 acres) (this habitat was not mapped on the 1950’s black-and-white photographs). Finally, there was a net decline in the mapped area of Gulf beaches, decreasing in total area by 231 ha (571acres) from the 1950’s through 1979, and by 95 ha (235 acres) from 1979 through 2002–04, a net change of almost -40% since the 1950’s.
|
Habitat |
1950's |
1979 |
2002-04 |
|||
|
|
ha |
acres |
ha |
acres |
ha |
acres |
|
Estuarine marsh |
1,763 |
4,356 |
3,087 |
7,627 |
4,009 |
9,906 |
|
Mangrove |
Not mapped |
- |
665 |
1,642 |
837 |
2,068 |
|
Tidal flat |
13,647 |
33,722 |
6,114 |
15,109 |
6,121 |
15,125 |
|
Seagrass |
4,167 |
10,297 |
7,704 |
19,036 |
8,398 |
20,752 |
|
Palustrine marsh |
665 |
1,643 |
890 |
2,199 |
767 |
1,895 |
|
Gulf beach |
861 |
2,128 |
630 |
1,557 |
535 |
1,322 |
Table 1. Total area of major habitats in the1950’s, 1979 and 2002–04 in study area.
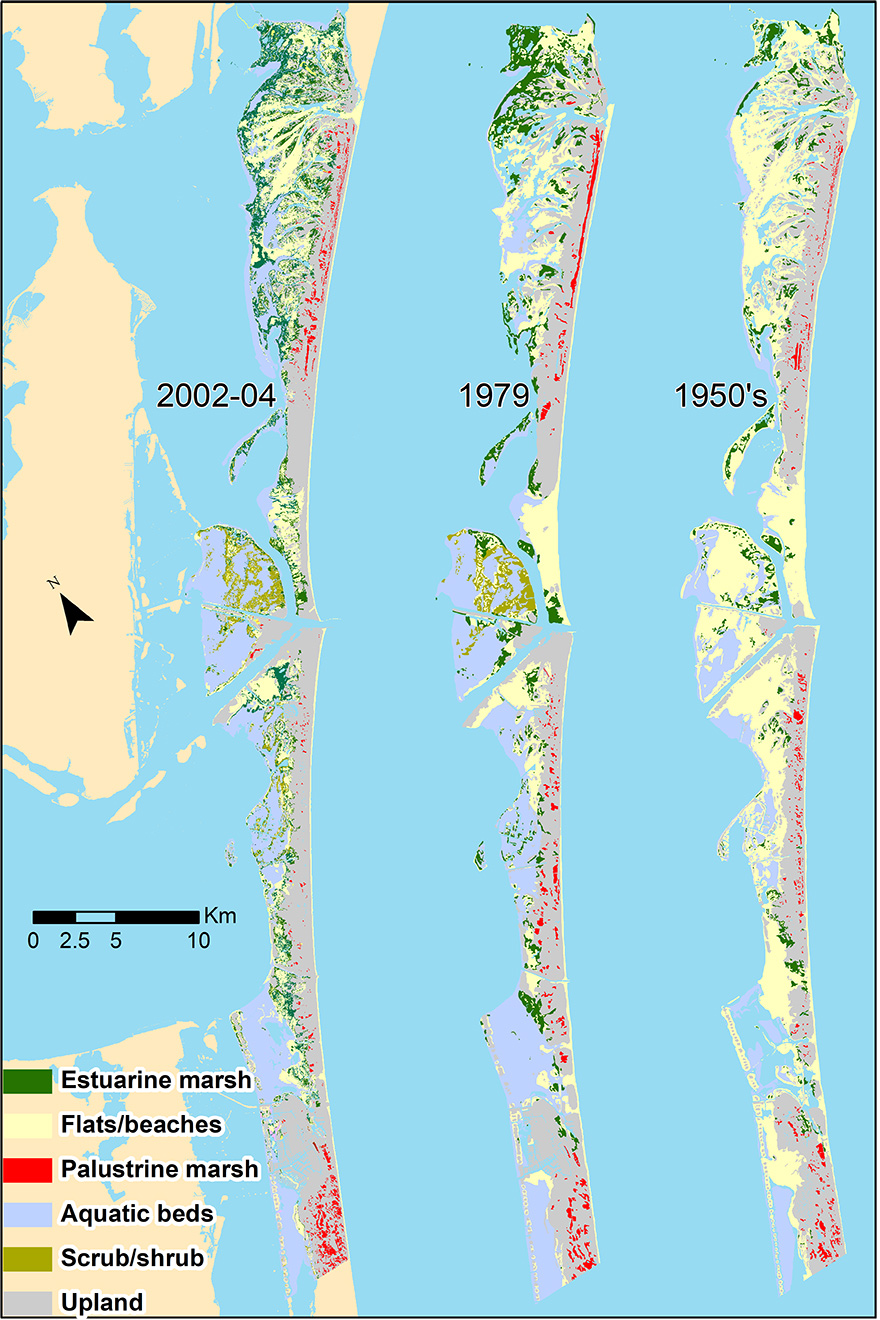
Figure 1. Map showing distribution of major wetland and aquatic habitats in 2002–04, 1979, and 1950’s in study area.
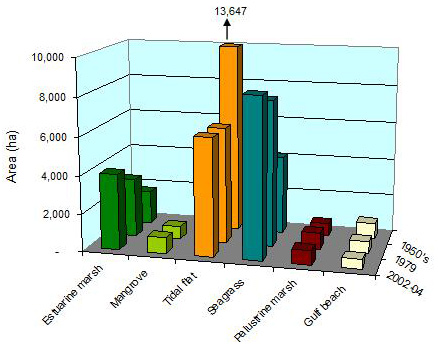
Figure 2. Areal distribution of major habitats in the study area in the 1950’s, 1979, and 2002–04.