Brownsville-Harlingen Area
STATUS AND TRENDS OF INLAND WETLAND AND AQUATIC HABITATS
This report presents results of an investigation designed to determine the current status and historical trends of wetlands and associated aquatic habitats in the Brownsville–Harlingen area. The study area is within Cameron, Willacy, and Kenedy Counties.
The Brownsville–Harlingen area in South Texas encompasses the long and narrow Laguna Madre, which grades into broad wind-tidal flats along the mainland and into smaller lagoons and embayments. The mainland is characterized by broad beaches, vegetation-stabilized dunes, active dune fields, expansive wind-tidal flats, brackish- and saltwater ponds and marshes, and black mangrove communities. Laguna Atascosa National Wildlife Refuge (NWR) is included in the study area.
Unlike estuaries of the central and upper Texas coast, where rivers discharge into bays forming typical estuaries diluted by fresh-water inflows, the Rio Grande in South Texas discharges into the Gulf of Mexico. Laguna Madre has no major rivers discharging into it. That fact, coupled with the fact that this area receives the least amount of precipitation of all areas along the Texas coast (average annual precipitation in Willacy County is about 70 cm and in Cameron County, 68 cm) (Texas Almanac, 2000–2001) contribute to high salinities in Laguna Madre. In addition to high-salinity regimes, climate strongly dictates the relative importance of many significant geological processes. Among them are the direction and intensity of persistent southeast winds that control the movement of wave trains approaching the shore and the resulting direction of long-shore currents and sediment transport. Geologically the relict Rio Grande Holocene–Modern deltaic system has been retreating for hundreds of years
Status, 2010
In 2010, wetland, aquatic, and upland habitats covered 251,734 ha (621,783 acres) within the study area, including open water in Laguna Madre. Approximately 153,511 ha (379,332 acres) within the study area was classified as uplands. Of the four wetland systems mapped, the estuarine system is the largest. Largest habitats are the estuarine open-water and seagrass (E1AB3) classes, together covering 51,600 ha (127,506 acres). Seagrass beds extend beyond the study area into Laguna Madre. Wind-tidal and algal flats (E2US and E2AB) cover 12,666 ha (31,298 acres), about 47% of which is algal flats. Emergent vegetated wetlands (E2EM, E2SS, and PEM) cover 25,538 ha (63,106 acres), roughly 55% of which is palustrine marsh.
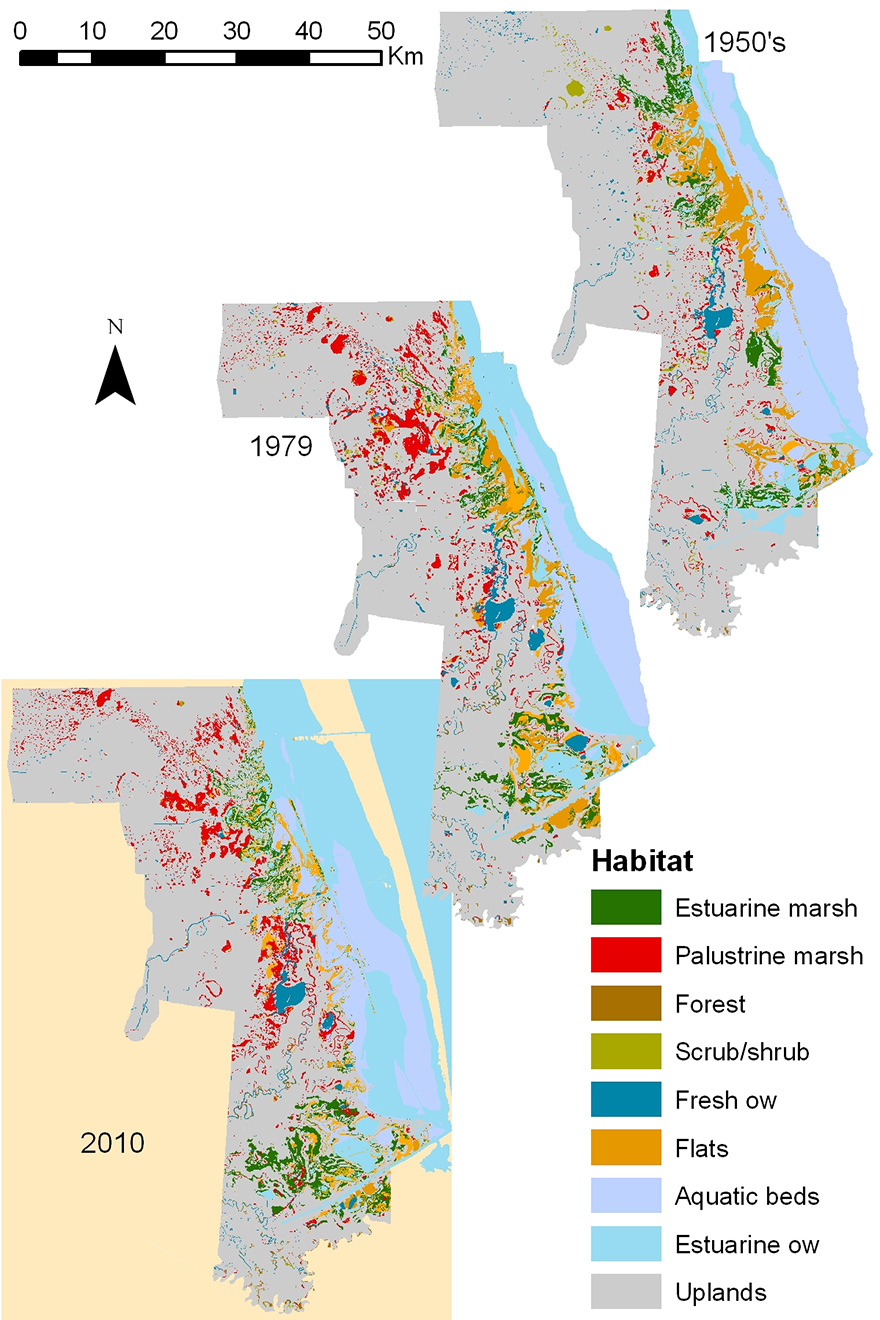
Figure 1. Maps showing distribution of major wetland and aquatic habitats in 2010, 1979, and the 1950’s in the Brownsville–Harlingen study area. Seagrass shown only within map area in Laguna Madre.
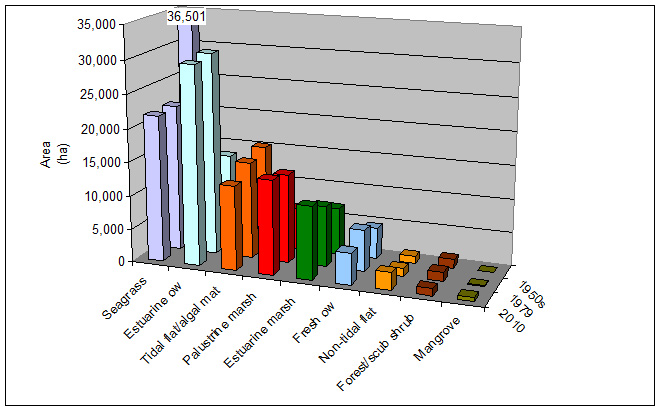
Figure 2. Areal extent (ha) of selected habitats from the 1950’s through 2010
Trends
Analysis of trends in wetlands and aquatic habitats from the 1950’s through 2010 shows that seagrass decreased from the 1950’s through 1979 and increased slightly from 1979 through 2010 (Table 1; Fig. 1 & 2). Much of the decline in 1979 may have been an apparent and not real decline, as a result of high-water levels and turbidities, which can obscure submerged seagrasses on aerial photographs. Seagrass and estuarine open water are, by far, the most extensive habitats. The large difference in area of estuarine open water, which covered an area more than twice as large in 1979 as in the 1950’s and 2010 (Table 1), appears to be due to higher water levels “captured” in the 1979 aerial photographs that flooded the tidal flats. This flooding was a coastwide phenomenon. Tidal flats and algal mats declined systematically throughout the study time period. The 1950’s total of 15,307 ha (37,807 acres) declined to 14,434 ha (35,651 acres) in 1979 and further declined to 12,666 ha (31,286 acres) in 2010. The broader distribution of flats in the 1950’s may be partly related to the mid-1950’s drought, when estuarine open water was apparently at lower levels than in 1979 or 2010, and when more flats were exposed. This trend is consistent with the coastwide reduction in tidal flats. The total area of palustrine marsh increased between periods, with the largest jump between the 1950’s total of 6,307 ha (15,579 acres) and the1979 total of 13,272 ha (32,782 acres). This increase is also likely due to drier conditions in the 1950’s. Estuarine marsh followed a similar trend, with the largest increase from 7,057 ha (17,432 acres) in the 1950’s to 9,112 ha (22,506 acres) in 1979. Salt marshes expanded into previous tidal flats and upland areas through time. Forest and palustrine scrub-shrub increased slightly in 1979, then decreased in 2010, losing a total of 283 ha (699 acres), or roughly (-)20% of the original amount. Mangroves, however, could not be adequately mapped separately on the black-and-white 1950’s photographs and were included with marshes in most areas. Mangrove distribution increased dramatically from 1979 through 2010.
|
Habitats |
1950's |
1979 |
2010 |
|||
|
|
(ha) |
(acres) |
(ha) |
(acres) |
(ha) |
(acres) |
|
Seagrass |
36,501 |
90,158 |
21,968 |
54,261 |
22,129 |
54,659 |
|
Estuarine open water |
13,464 |
33,257 |
30,236 |
74,683 |
29,471 |
72,793 |
|
Tidal flat/algal mat |
15,307 |
37,807 |
14,434 |
35,651 |
12,666 |
31,286 |
|
Palustrine marsh |
6,307 |
15,579 |
13,272 |
32,782 |
14,106 |
34,841 |
|
Estuarine marsh |
7,057 |
17,432 |
9,112 |
22,506 |
10,906 |
26,938 |
|
Fresh open water |
4,666 |
11,526 |
6,229 |
15,387 |
4,769 |
11,779 |
|
Nontidal flat |
1,108 |
2,736 |
1,220 |
3,014 |
2,596 |
6,413 |
|
Forest/scrub shrub |
1,337 |
3,302 |
1,436 |
3,547 |
1,054 |
2,604 |
|
Mangrove |
33 |
80 |
139 |
344 |
526 |
1,299 |
Table 1. Areal distribution of selected habitats, 1950’s through 2010, in the Brownsville–Harlingen study area. Palustrine, lacustrine, and riverine unconsolidated bottom are combined into fresh open water in the table.