Galveston Island and Bolivar Peninsula
STATUS AND TRENDS OF WETLAND AND AQUATIC HABITATS ON BARRIER ISLANDS, UPPER TEXAS COAST, GALVESTON AND CHRISTMAS BAYS
This report presents results of an investigation to determine current status and historical trends of wetlands and associated aquatic habitats along the upper coast of Texas’ barrier island system from the northeastern corner of Galveston’s East Bay to the southwestern corner of Christmas Bay. The study area encompasses Bolivar Peninsula, Galveston Island, and Follet’s Island, an area that is located within Galveston and Brazoria Counties along the upper Texas coast. Galveston Island and Bolivar Peninsula are broad accretionary barriers with low fore-island dunes, extensive back-island estuarine marshes, and numerous relict beach ridges and intervening swales that are the sites of palustrine marshes in the central part of the island. Development is extensive on Galveston Island and Bolivar Peninsula. Follet’s Island, a much narrower barrier that is undergoing erosion along much of its length, is characterized by low fore-island dunes, productive back-island estuarine marshes, and in adjacent Christmas Bay, ecologically important seagrass beds.
Status, 2002
Major estuarine and palustrine habitats in the study area include salt, brackish, and fresh marshes, tidal flats, and seagrass beds. Areas of estuarine open water are also important components of the salt and brackish marsh complex. The primary habitat mapped in the marine system is the Gulf beach, which consists of a topographically lower forebeach and a higher, less frequently flooded backbeach.
In 2002, wetland and aquatic habitats (excluding open water) were dominated by estuarine marshes, with a total area of 7,715 ha (19,048 acres), followed by tidal flats totaling 771 ha (1,904 acres), and palustrine marshes at 607 ha (1,499 acres) (Fig. II). Palustrine flats and water bodies had a total area of 381 ha (941 acres), and wetland scrub/shrub wetlands 39 ha (96 acres). Along the Gulf shoreline, the area of mapped beaches totaled 556 ha (1,373 acres). Lacustrine habitats, consisting primarily of impounded water and barren flats, had a total area of 797 ha (1,968 acres).
Trends
From the 1950’s through 2002 within the study area, all wetland classes, with the exception of scrub-shrub, underwent net losses (Table 1; Fig, 1 & 2). In general, estuarine marshes decreased in total area during each period (1950’s–1979 and 1979–2002), with a total net loss of 1,552 ha (3,833 acres) from the 1950’s to 2002. Approximately 70% of this loss occurred from the 1950’s through 1979, indicating that the rate of loss decreased from 1979 to 2002. The average rate of marsh loss during the earlier period was about 48 ha/yr (119 acres/yr), and for the more recent period, about 19 ha/yr (47 acres/yr). Losses were also extensive in tidal-flat habitats, which had a net decline from the 1950’s to 2002 of 1,600 ha (3,950 acres), with most of the loss, 1,162 ha (2,869 acres), occurring during the later period. The rates of tidal-flat loss were 19 ha/yr (47 acres/yr) during the earlier period (1950’s–1979) and 51 ha/yr (126 acres/yr) during the later period (1979–2002), which are rates that are opposite to the rates of marsh loss for the two periods. Seagrass beds decreased in total area by about 1,000 ha (2,470 acres) from the 1950’s through 1979, a year in which none were mapped, although seagrasses were in Christmas Bay at that time. A total of 116 ha (286 acres) were mapped in 2002 in Christmas and West Bays. Palustrine marshes had their largest distribution in the 1950’s, at 1,045 ha (2,580 acres), and lowest in 2002, at 607 ha (1,499 acres) (Table 1). The total area of mapped scrub-shrub was slightly larger in 1979 than in the 1950’s and 2002 (Table 1). Finally, there was a net decline in the mapped area of Gulf beaches, decreasing in total area by 384 ha (948 acres) from the 1950’s through 1979 and 74 ha (182 acres) from 1979 to 2002, a net change of almost 45% since the 1950’s.
Table 1. Total area of major habitats in the 1950’s, 1979, and 2002 in study area.
| Habitat | 1950's | 1979 | 2002 | |||
| (ha) | (acres) | (ha) | (acres) | (ha) | (acres) | |
| Estuarine marsh | 9267 | 22880 | 8375 | 20678 | 7715 | 19048 |
| Tidal flat | 2371 | 5854 | 1933 | 4774 | 771 | 1904 |
| Seagrass | 1009 | 2491 | ? | ? | 116 | 286 |
| Palustine marsh | 1045 | 2580 | 618 | 1525 | 607 | 1498 |
| Scrub-shrub | 34 | 84 | 45 | 111 | 39 | 96 |
| Gulf beach | 1013 | 2501 | 629 | 1553 | 556 | 1373 |
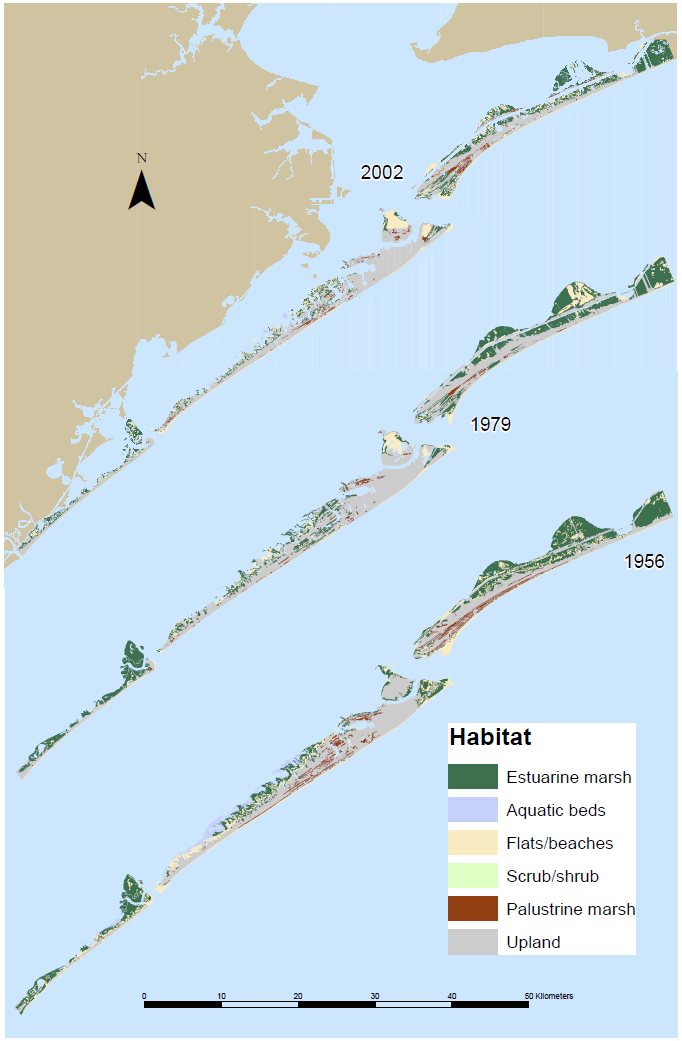
Figure 1. Maps showing distribution of major wetland and aquatic habitats in the study area in 2002, 1979, and the 1950’s.
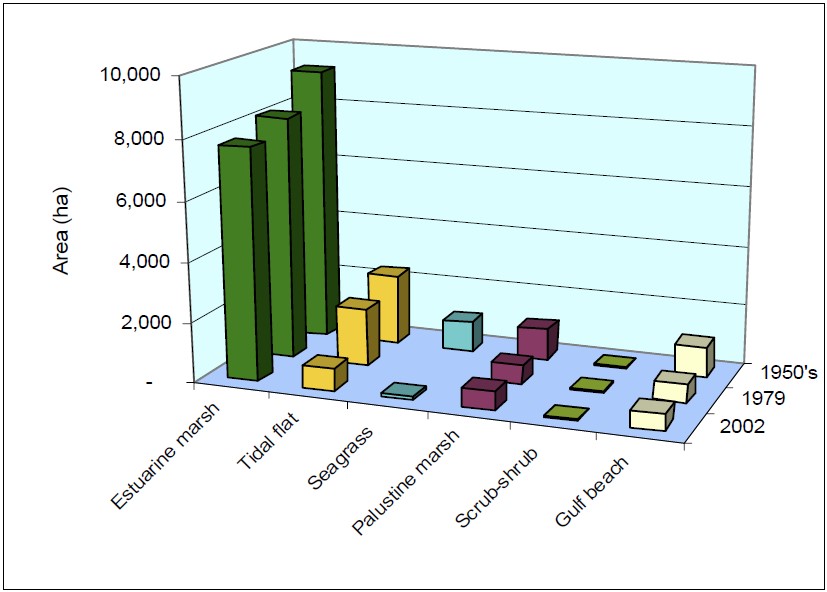
Figure 2. Areal distribution of major habitats in the study area in the 1950’s, 1979, and 2002.