Corpus Christi and Aransas Bays Area
STATUS AND TRENDS OF INLAND WETLAND AND AQUATIC HABITATS
This report presents results of an investigation to determine current status and historical trends of wetlands and associated aquatic habitats in the Corpus Christi area from Lamar Peninsula to Encinal Peninsula. The study area encompasses most of the mainland between the Gulf Intracoastal Waterway (GIWW) and the Texas General Land Office Coastal Management Program boundary, an area that is located within Refugio, Aransas, San Patricio, and Nueces Counties. Natural environments include wetlands, wind-tidal flats, riparian woodlands, and bay shorelines.
Status, 2004
Major estuarine and palustrine habitats in the study area include salt, brackish, and fresh marshes; tidal flats; and seagrass beds. Areas of estuarine open water are
also important components of the salt and brackish-marsh complex. In 2004 in the study area, wetland and aquatic habitats (excluding open water) were dominated by estuarine marsh at 10,821 ha (26,728 acres), followed by seagrass beds with a total area of 9,975 ha (24,638 acres) and palustrine marsh totaling 5,630 ha (13,906 acres). Tidal flats, including algal mats, had a total area of 3,040 ha (7,509 acres), and palustrine forest (including scrub/shrub) had an area of 885 ha (2,186 acres). Palustrine open water/flats and Lacustrine habitats totaled 3,753 ha (9,270 acres).
Trends
From the 1950’s through 2004 within the study area, some wetland classes underwent substantial net losses and gains, whereas others remained more stable (Table 1, Fig. 1 & 2). In general, estuarine marshes, combined with scrub/shrub, increased in total area during the period 1950’s–1979 and decreased in total area during the period 1979–2004, with a total net gain of 1,956 ha (4,831 acres) from the 1950’s through 2004. The average rate of marsh gain during the earlier period was about 126 ha/yr (311 acres/yr) and for the more recent period, a loss of about 38 ha/yr (94 acres/yr). The overall rate of change between the 1950’s and 2004 was a gain of about 41 ha/yr (101 acres/yr).
Seagrasses increased in total area during each period (1950’s–1979 and 1979–2004), with a total net gain of 2,339 ha (5,777 acres) from the 1950’s through 2004. Approximately 87% of this gain occurred from 1979 through 2004. The average rate of seagrass gain during the earlier period was about 13 ha/yr (32 acres/yr) and for the more recent period, about 82 ha/yr (202 acres/yr). The overall rate of seagrass changes between the 1950’s and 2004 was an increase of about 49 ha/yr (120 acres/yr).
The most extensive losses in habitats occurred in tidal flats, which underwent a major
net decline from the 1950’s through 1979. Total area of tidal flats decreased by 4,919 ha (12,150 acres) during this period (1950’s–1979). During the later period (1979–2004), total area of tidal flats decreased an additional 1,632 ha (4,031 acres). The average rate of tidal-flat loss during the earlier period was about 214 ha/yr (514 acres/yr) and for the more recent period, a loss of about 65 ha/yr (161 acres/yr). Roughly 30% of tidal-flat change occurred where estuarine marsh spread into areas previously mapped as tidal flats.
Palustrine marsh had its largest distribution in the 1950’s, at 8,489 ha (20,968 acres), and lowest in the 2004 at 5,630 ha (13,906 acres) (Table 1). The average rate of palustrine marsh loss for both time periods was about 60 ha/yr (147 acres/yr). Most palustrine marsh loss was located in areas that had become estuarine marsh because of landward movement of the salt/freshwater boundary within the river system.
Palustrine open water and flats experienced a relatively consistent increase through time. Average rate of gain of palustrine water and flats during the earlier period was about 12 ha/yr (30 acres/yr), and for the more recent period, about 10 ha/yr (26 acres/yr). On Live Oak Peninsula, palustrine open-water totals increased by 280% between the 1950’s total of 91 ha (218 acres) and 1979, when open water totaled 346 ha (830 acres). Much higher precipitation levels most likely accounted for the 1979 increase. By 2004, long-term drought had reduced the amount of palustrine open water to 188 ha (470 acres).
Finally, there was a net decrease in the mapped area of palustrine forest and scrub/shrub habitats, decreasing in total area by 202 ha (505 acres) from the 1950’s through 2004, a net loss of almost (–)23% since the 1950’s. A peak of 1,360 ha (3,400 acres) was mapped in 1979.
|
Habitat |
1950's |
1979 |
2004 |
|||
|
|
ha |
acres |
ha |
acres |
ha |
acres |
|
Estuarine marsh/ss |
8,856 |
21,874 |
11,749 |
29,020 |
10,821 |
26,728 |
|
Seagrass |
7,611 |
18,799 |
7,905 |
19,525 |
9,950 |
24,577 |
|
Palustrine marsh |
8,489 |
20,968 |
7,120 |
17,586 |
5,630 |
13,906 |
|
Tidal flats/ algal mats |
9,591 |
23,690 |
4,672 |
11,540 |
3,040 |
7,509 |
|
Lacustrine |
383 |
946 |
1,762 |
4,352 |
2,254 |
5,567 |
|
Palustrine water/flats |
957 |
2,364 |
1,239 |
3,060 |
1,499 |
3,703 |
|
Palustrine forest/ss |
683 |
1,687 |
1,360 |
3,359 |
885 |
2,186 |
Table 1. Total area of major habitats in the1950’s, 1979, and 2004 in study area.
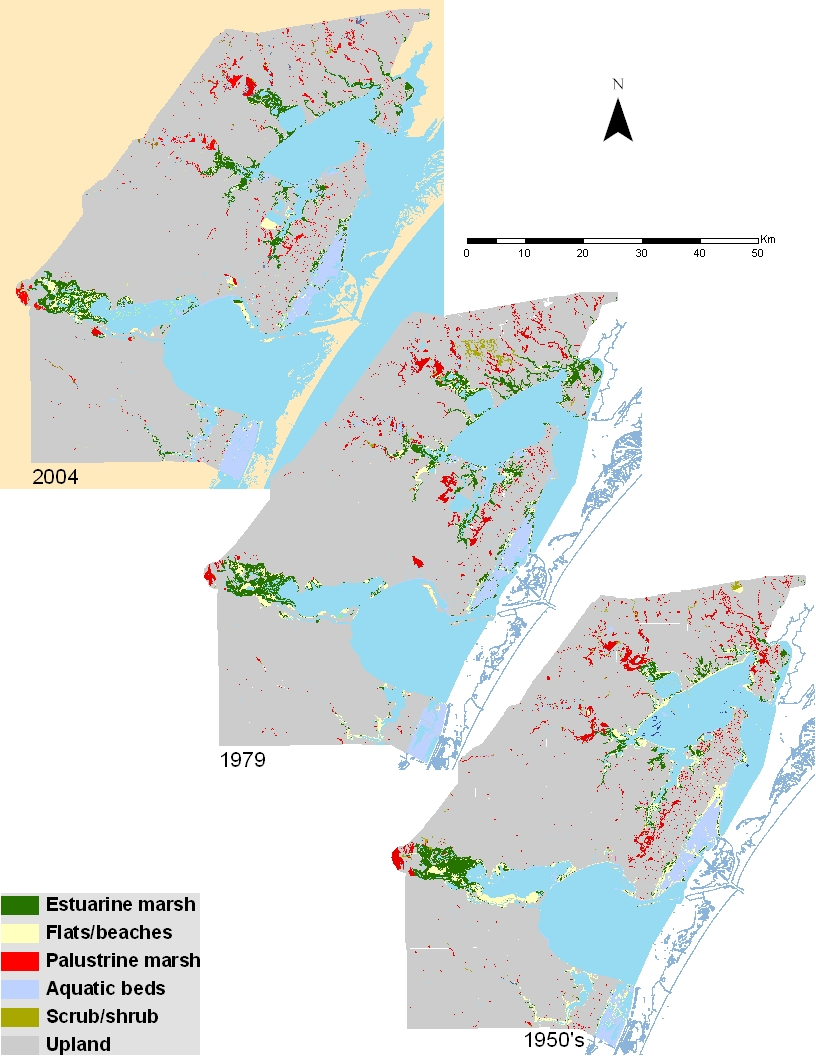
Figure 1. Map showing distribution of major wetland and aquatic habitats in 2004, 1979, and 1950’s in study area.
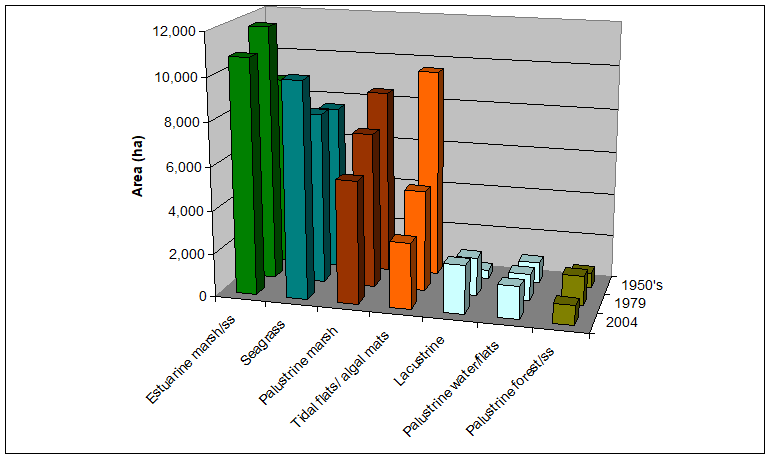
Figure 2. Areal distribution of major habitats in the study area in the 1950’s, 1979, and 2004.