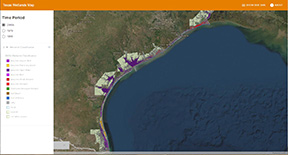
Matagorda Bay
STATUS AND TRENDS OF INLAND WETLAND AND AQUATIC HABITATS
This report presents results of a status-and-trend study of the central Texas Coast along the inland wetland system from San Antonio Bay to Caney Creek. The study area is characterized by Matagorda Bay, a large bay-estuary system dominated by the Colorado River valley and Lavaca River fluvial-deltaic system. The Lavaca and Navidad Rivers discharge into Matagorda Bay, and prior to diversion in 1992, the Colorado River discharged into the Gulf of Mexico. The study area encompasses most of the mainland between Matagorda Bay and the Texas General Land Office (GLO) Coastal Management Program (CMP) boundary, an area that is located within Matagorda, Calhoun, Jackson, and Victoria Counties. Natural environments include wetlands, tidal flats, riparian woodlands, and bay shorelines.
The Matagorda Bay area is one of the most extensive bay-estuary systems along the central Texas Gulf Coast. Most of the marshland in the area falls within privately owned property, but large tracts of marsh are also found in Big Boggy National Wildlife Refuge (NWR), Mad Island Wildlife Management Area (WMA), and other smaller wildlife management areas. Extensive brackish- and salt-water marshes and ponds characterize the areas near bay margins. Most freshwater marshes occur inland of the bays.
Status, 2008
Major habitats in the study area include salt and fresh marshes and fresh open water. Forests are next in areal distribution. Tidal flats are limited in extent. The primary habitat mapped in the fresh, open-water system is the lacustrine, which consists of diked and leveed containment areas.
In 2008, wetland and aquatic habitats were dominated by estuarine marshes, with a total area of 17,195 ha (42,490 acres), followed by palustrine marshes totaling 11,384 ha (28,131 acres), fresh open water (ow) totaling 6,825 ha (16,865 acres), forest/scrub-shrub at 6,010 ha (14,851 acres), and tidal flats covering 1,764 ha (4,359 acres). The most plentiful aquatic habitat was estuarine open water, covering 94,414 ha (233,302 acres). Cartographic error, at the study site scale, precluded comparisons of estuarine open-water area between study time periods. Lacustrine flats and algal beds had a total area of 545 ha (1,347 acres), and palustrine flats had a total area of 184 ha (455 acres).
Trends
Estuarine marshes are by far the dominant class of emergent wetlands in the Matagorda Bay study area; therefore, for simplification and to reduce apparent changes due to interpretation, emergent wetland classes in the trend analysis were combined.
From 1956 through 2008, emergent wetlands (marshes) increased from about 27,942 ha (69,046 acres) to 28,579 ha (70,620 acres), a gain of approximately 637 ha (1,574 acres) (Table 1; Fig. 1 & 2). Marsh area fluctuated through the study time period. The rate of marsh gain from 1956 to 1979 was 172 ha/yr (425 acres/yr), and from 1979 to 2008, marsh losses were about (–)114 ha/yr (282 acres/yr). Fresh open water experienced a systematic increase in area through time. The gain in fresh open water was approximately 3,387 ha (8,370 acres). Rates of gain in fresh open water were about 94 ha/yr (232 acres/yr) during the earlier period and 42 ha/yr (104 acres/yr) during the later period. The overall fresh-open-water trend rate (1956–2008) was a gain of 65 ha/yr (161 acres/yr). The area of forest and scrub-shrub decreased substantially through time, from 8,734 ha (21,582 acres) in 1956 to 6,010 ha (14,851 acres) in 2008. Rates of change in forest were about (–)156 ha/yr (386 acres/yr) during the earlier period and (+)30 ha/yr (74 acres/yr) during the later period. Tidal flats decreased in area from 5,155 ha (12,738 acres) in1956 to 1,764 ha (4,358 acres) in 2008, a loss of about 3,391 ha (8,379 acres).
|
Habitat |
1950's |
1979 |
2008 |
|||
|
|
ha |
acres |
ha |
acres |
ha |
acres |
|
Estuarine marsh |
17,651 |
43,617 |
22,828 |
56,409 |
17,195 |
42,490 |
|
Palustrine marsh |
10,291 |
25,430 |
9,065 |
22,400 |
11,384 |
28,131 |
|
Fresh ow |
3,438 |
8,496 |
5,609 |
13,860 |
6,825 |
16,865 |
|
Forest |
8,734 |
21,582 |
5,145 |
12,714 |
6,010 |
14,851 |
|
Tidal flats |
5,155 |
12,738 |
1,544 |
3,815 |
1,764 |
4,359 |
Table 1. Total area of major habitats in 1956, 1979, and 2008.
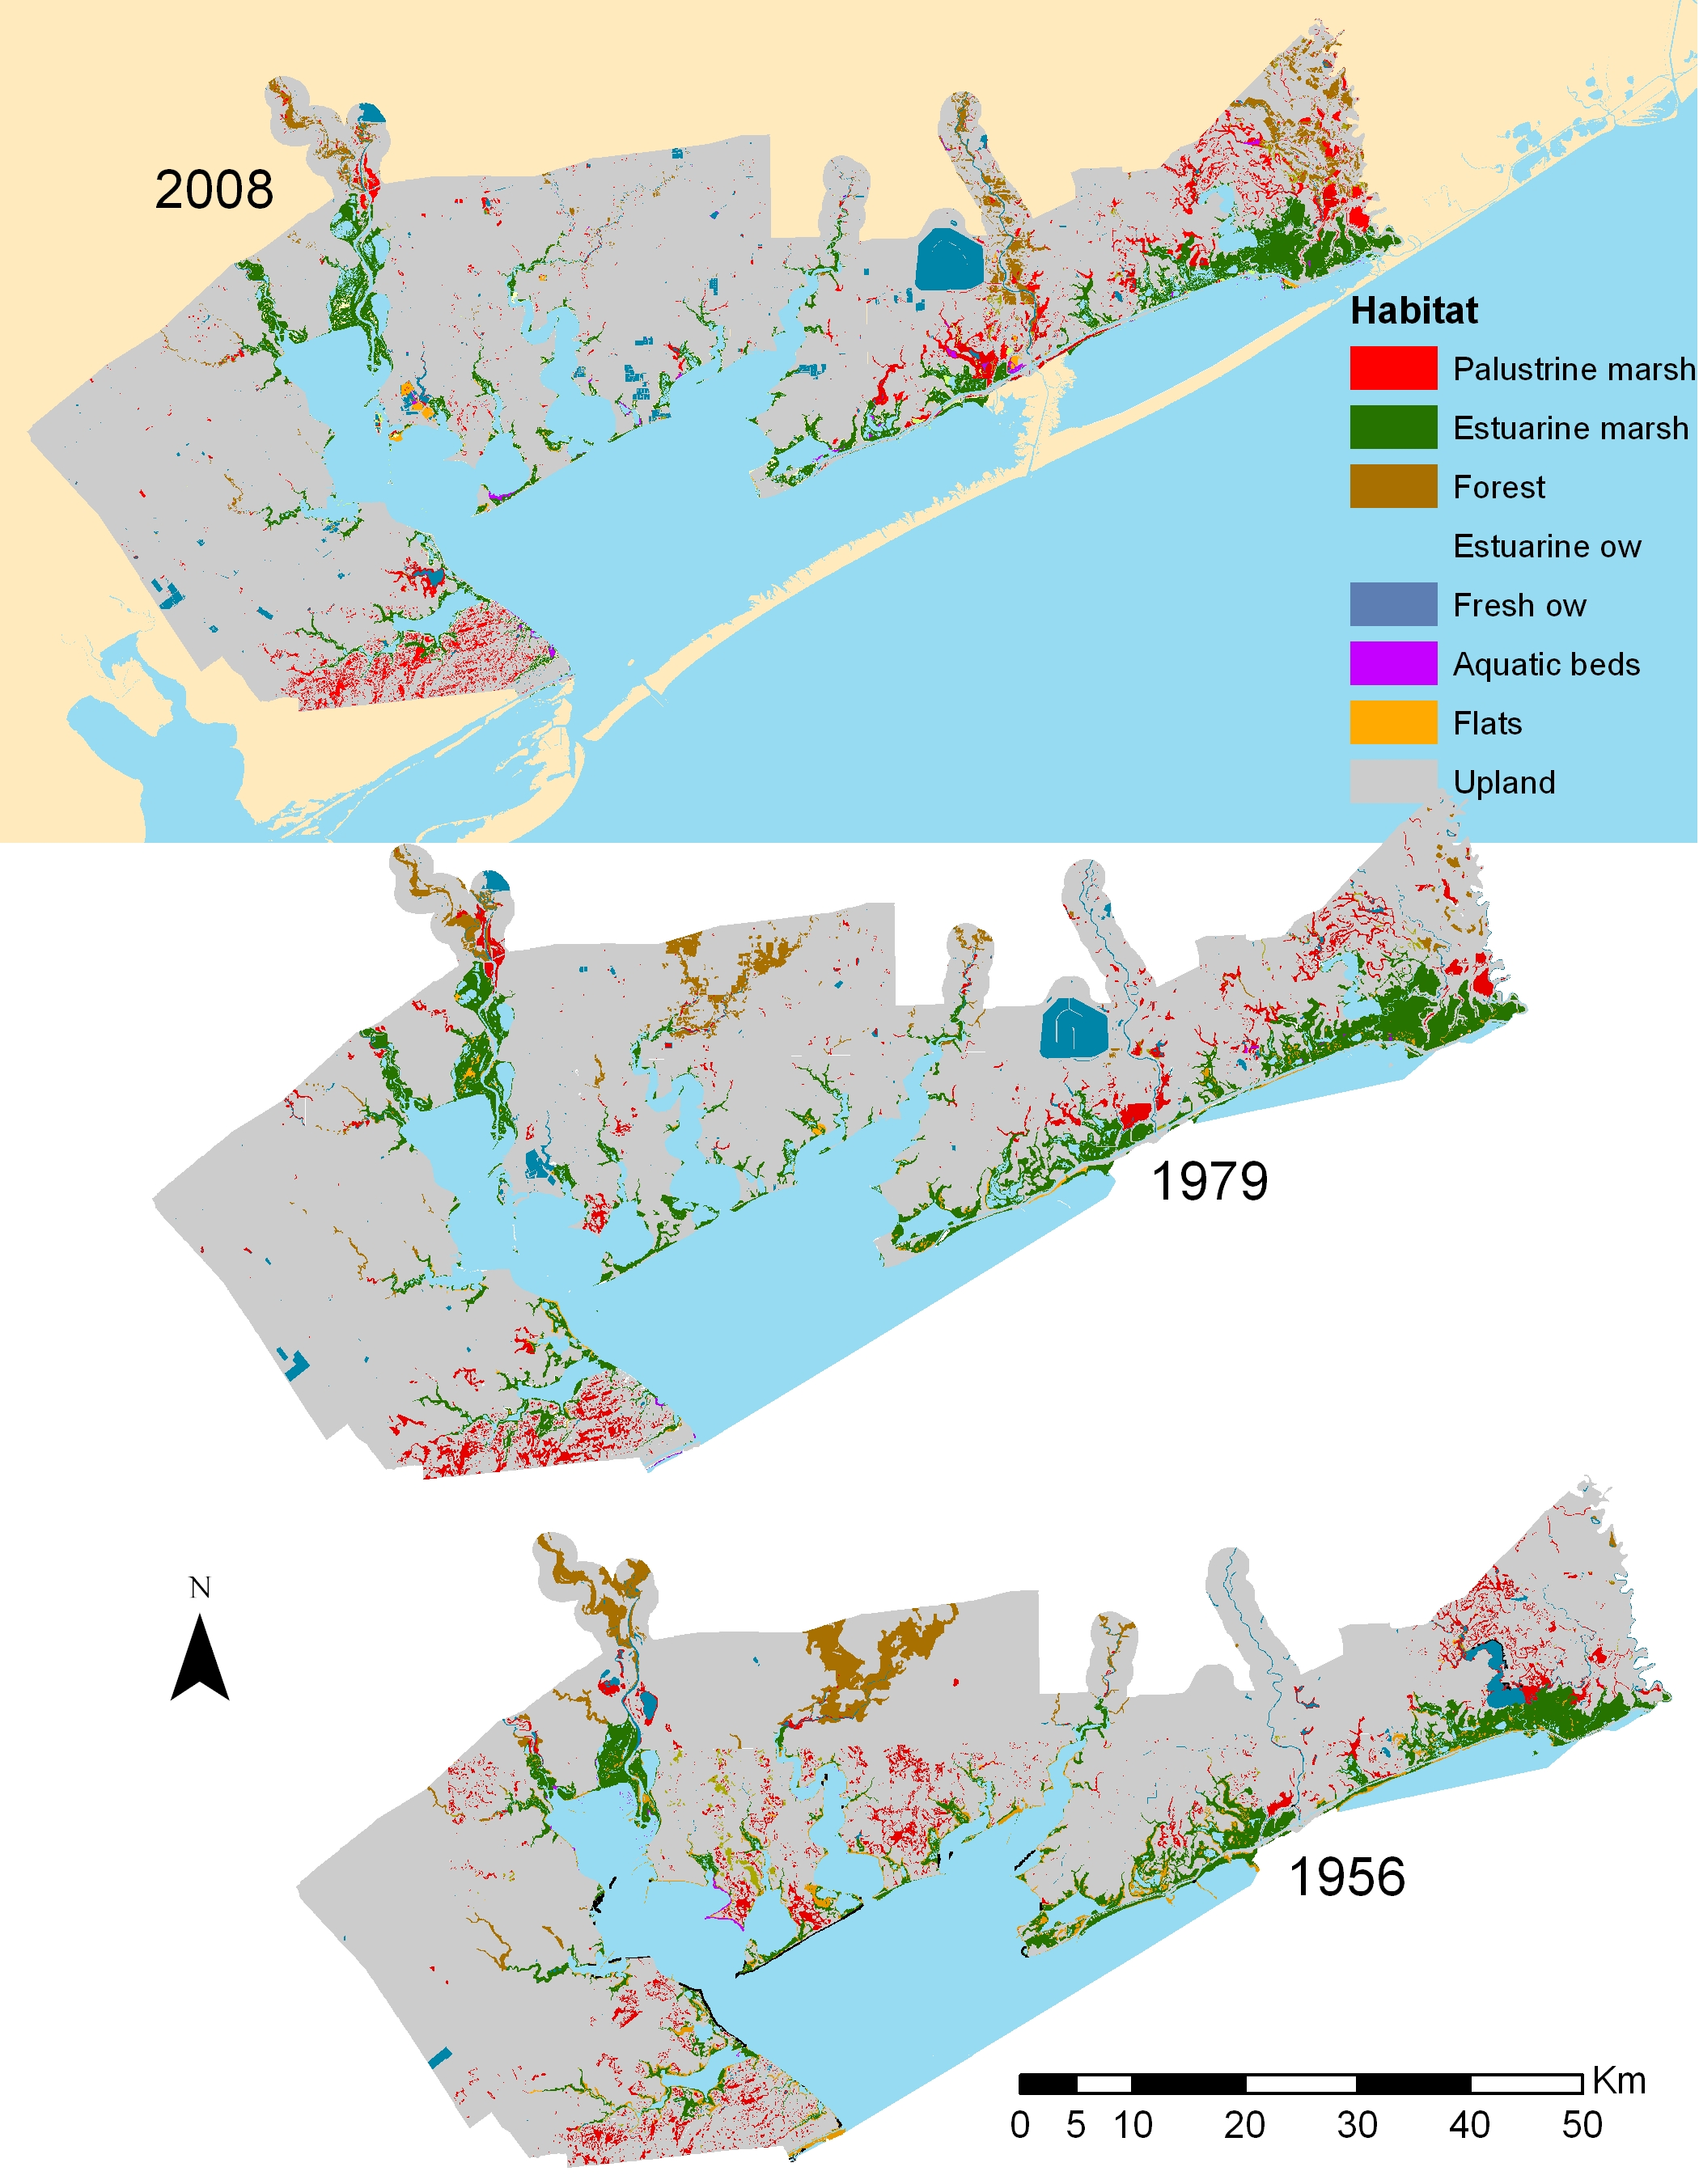
Figure 1. Maps showing distribution of major wetland and aquatic habitats in 2008, 1979, and 1956 in the Matagorda Bay area.
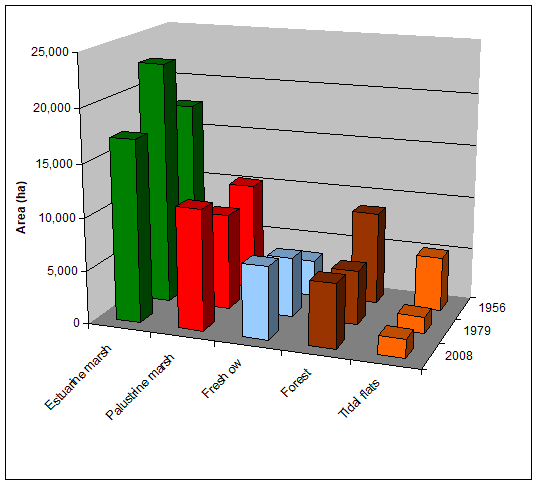
Figure 2. Areal distribution of major habitats in the study area in 1956, 1979, and 2008.