Freeport and San Antonio Bay Areas
STATUS AND TRENDS OF INLAND WETLAND AND AQUATIC HABITATS
Download Report
Download Freeport Data
Download San Antonio Bay Data
This report presents results of two investigations designed to determine current status and historical trends of wetlands and associated aquatic habitats along (1) the Texas Gulf coast from the Brazos River southwestward to Caney Creek, an area that includes the San Bernard River valley near Freeport, and (2) San Antonio Bay, the bay system that includes the Guadalupe River delta and extends from Espiritu Santo Bay to the Aransas National Wildlife Refuge. The northern study area is within Brazoria and Matagorda Counties, and the southern study area is within Calhoun and Refugio Counties.
The two study areas are very different. The area near Freeport is part of a delta plain without natural barrier islands. Islands that front this part of the coast were created by the Gulf Intracoastal Waterway (GIWW) that was dredged across this mainland area to connect the Galveston Bay system with the Matagorda Bay system. Included in this area are the Stringfellow and Peach Point Wildlife Management Areas (WMA’s). Along this stretch of coast, the Brazos and San Bernard Rivers discharge into the Gulf of Mexico.
The dominant feature of San Antonio Bay is the bayhead delta at the mouth of the Guadalupe River. The delta, situated gulfward of the confluence with the San Antonio River, has been hydrologically modified to manage fresh-water inflow to the bay. The system is characterized by secondary bays, including Hynes Bay and Mission Lake, and expansive brackish- and saltwater ponds and marshes.
Freeport Area
Status, 2009
Major habitats in the estuarine and palustrine system include salt, brackish, and fresh marshes, forest and scrub/shrub, tidal flats, oyster reefs, and aquatic beds. Estuarine open water is also an important component of the salt and brackish marsh complex.
In 2009, wetland and aquatic habitats were dominated by estuarine marshes, with a total area of about 6,907 ha (17,061 acres), followed by palustrine marshes totaling 5,314 ha (13,723 acres). These marshes make up 62% of the Freeport study area. The other major component of the study area is forest and scrub/shrub. However, owing to interpretational differences, forest area is not emphasized. Other habitats include open water and uplands. The study area was subdivided into geographic subareas—Cedar Lake Creek, San Bernard, Brazos, and Bryan Mound—to allow a more site-specific analysis of status and trends.
The most extensive estuarine emergent wetlands (brackish- and saltwater marshes) occur in the Brazos subarea, where 4,929 ha (12,180 acres) of estuarine marsh was mapped on 2009 photos. Brazos also contains the most palustrine marsh (2,684 ha; 6,632 acres) and estuarine open water (701 ha; 1,732 acres). Of the four subareas, Cedar Lake Creek has the most extensive forests (2,704 ha; 6,682 acres). Tidal flats are not widely distributed in this coastal area.
Trends
From the 1950’s through 2009 within the Freeport study area, there were losses and gains in most habitats. Analyses of spatial and temporal changes show that there was a net gain in estuarine marshes from the 1950’s through 2009. The total area of estuarine marsh increased from 5,238 ha (12,939 acres) in the 1950’s to 6,416 ha (15,847 acres) in 1979 to 6,906 ha (17,060 acres) in 2009 (Table 1; Fig. 1 & 2). This increase totaled 1,669 ha (4,122 acres) from the 1950’s through 2009. During the same time, there was a systematic decrease in tidal flats (E2FL or E2US). The area of flats declined from 249 ha (616 acres) in the 1950’s to 219 ha (540 acres) in 1979 to 183 ha (452 acres) in 2009 (Table I). These changes reflect a loss of 66 ha (164 acres) by 2009. Palustrine marshes (PEM) increased in area by 772 ha (1,906 acres) from the 1950’s through 1979 and by 2,808 ha (6,935 acres) from 1979 through 2009. The mapped area of forest, including scrub/shrub, increased from the 1950’s through 2009 by approximately 5,210 ha (12,868 acres). Distinguishing between upland and wetland forest is difficult, however, and total distribution, as interpreted on aerial photographs, is approximate. The area of fresh open water increased from the earlier years to 2009 by roughly 441 ha (1,090 acres). Estuarine open water in the study area also increased slightly from the 1950’s through 1979 and 2009.
|
Habitat |
1950's |
1979 |
2009 |
|||
|
|
(ha) |
(acres) |
(ha) |
(acres) |
(ha) |
(acres) |
|
Estuarine marsh |
5,238 |
12,939 |
6,416 |
15,847 |
6,907 |
17,060 |
|
Palustrine marsh |
1,735 |
4,285 |
2,506 |
6,191 |
5,314 |
13,126 |
|
Forest/scrub-shrub |
346 |
855 |
1,377 |
3,402 |
5,556 |
13,723 |
|
Fresh open water |
550 |
1,357 |
895 |
2,211 |
991 |
2,448 |
|
Estuarine open water |
711 |
1,756 |
722 |
1,783 |
875 |
2,161 |
|
Tidal flat |
249 |
616 |
219 |
540 |
183 |
452 |
Table 1. Total area of major habitats in the Freeport study area in the1950’s, 1979, and 2009.
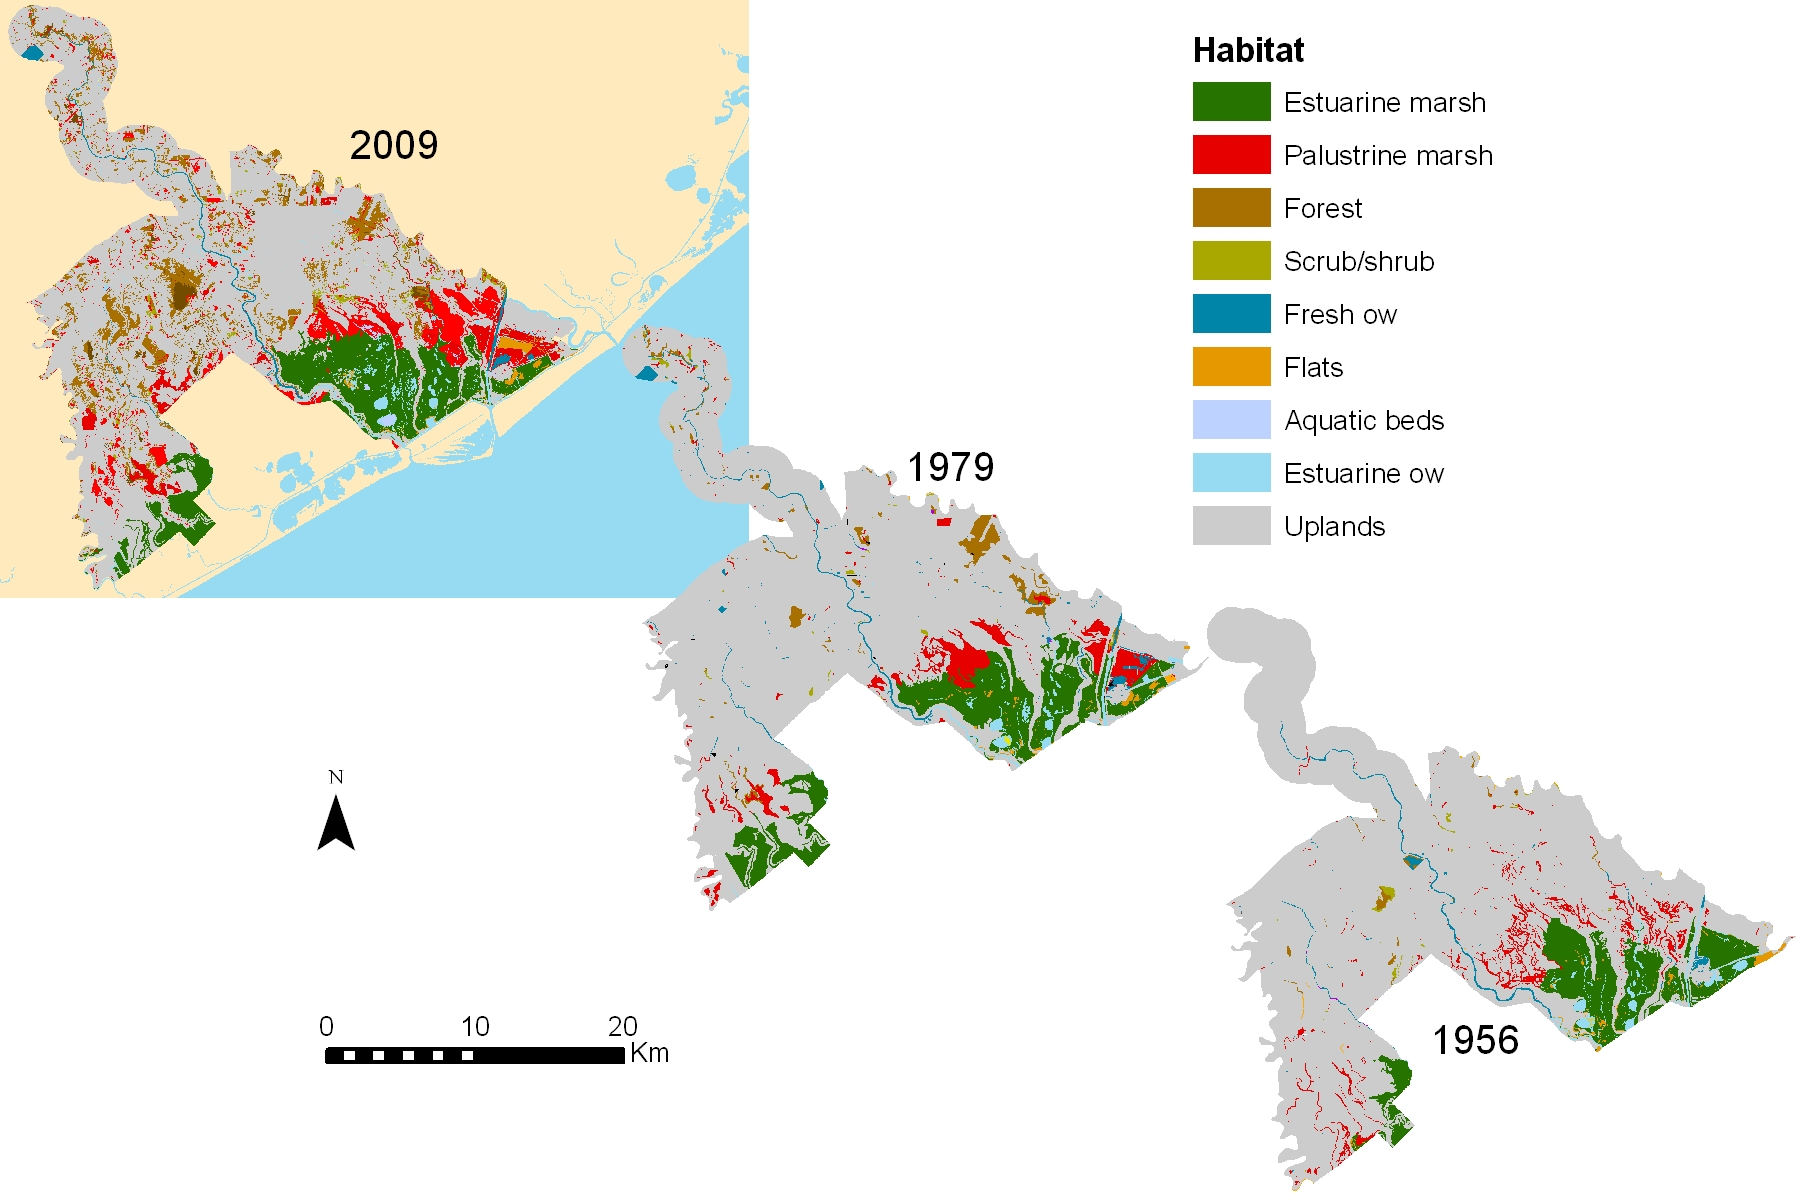
Figure 1. Map showing distribution of major wetland and aquatic habitats in 2009, 1979, and the 1950’s in the Freeport study area.
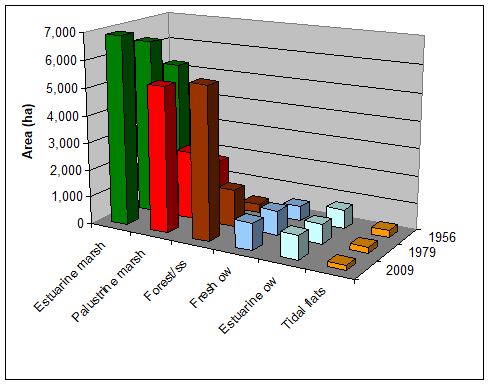
Figure2. Areal extent of major habitats in the Freeport study area in the 1950’s, 1979, and 2009.
San Antonio Bay Area
Status, 2009
In 2009, wetland and aquatic habitats covered 36,139 ha (89,301 acres) within the San Antonio Bay study area. Of the four wetland systems mapped, the palustrine system is the largest. The largest habitats are the open-water and marsh classes, together covering 23,188 ha (57,299 acres). Emergent vegetated wetlands (E2EM, E2SS, PEM) cover 11,044 ha (27,290 acres), with roughly equal amounts of palustrine and estuarine marsh. Other important habitat classes are seagrass (E1AB3), which in the study area has an area of 2,388 ha (5,898 acres); tidal-flat (E2US), which has 1,725 ha (4,261 acres); and fresh open water, which has 1,506 ha (3,720 acres).
Trends
Analysis of trends in wetlands and aquatic habitats from the 1950’s through 2009 shows that palustrine marsh decreased from the 1950’s through 1979 and increased from 1979 through 2009 (Table 2; Fig. 3 & 4). Palustrine marsh is the most extensive habitat. The lesser distribution in 1979 may be partly related to interpretational differences. However, land-management practices and accelerated relative sea-level rise had reduced palustrine-marsh area by 2009. The total area of estuarine marsh increased 58% between the mid-1950’s and 1979, remaining relatively stable thru 2009. Estuarine habitats had their largest distribution of 5,508 ha (13,605 acres) in 2009. The difference in total area was larger than that of the 1950’s (3,281 ha; 8,103 acres) but relatively consistent with the amount found in 1979 (5,170 ha; 12,771 acres). The large difference in area of estuarine marsh between the mid-1950’s and 2009 was mostly interpretational but was also due somewhat to management practices. Tidal flats lost 22% of the original resource of 2,211 ha (5,460 acres), diminishing to 1,725 ha (4,261 acres) in 2009. The tidal-flat low of 1,399 ha (3,456 acres) in 1979 was likely due to wetter ground conditions at the time of photography. The depletion of tidal flats is a coastwide phenomenon. Fresh, open-water area increased through time in the San Antonio Bay area, with the greatest amount of 1,814 ha (4,480 acres) in 1979. Conversely, the amount of forest declined drastically between the mid-1950’s and 2009, with a low of 614 ha (1,516 acres) in 1979. More than 70% of the forest area in 1956 was mapped as palustrine scrub-shrub (PSS); relatively little PSS was mapped in later years.
|
Habitats |
1950's |
1979 |
2009 |
|
Palustrine marsh |
6,547 |
4,742 |
5,536 |
|
Estuarine marsh |
3,281 |
5,170 |
5,508 |
|
Tidal/algal flat |
2,211 |
1,399 |
1,307 |
|
Fresh open water |
1,277 |
1,814 |
1,506 |
|
Forest/scrub shrub |
1,667 |
614 |
687 |
Table 2. Areal distribution (ha) of selected habitats, 1950’s through 2009, in the San Antonio Bay study area.
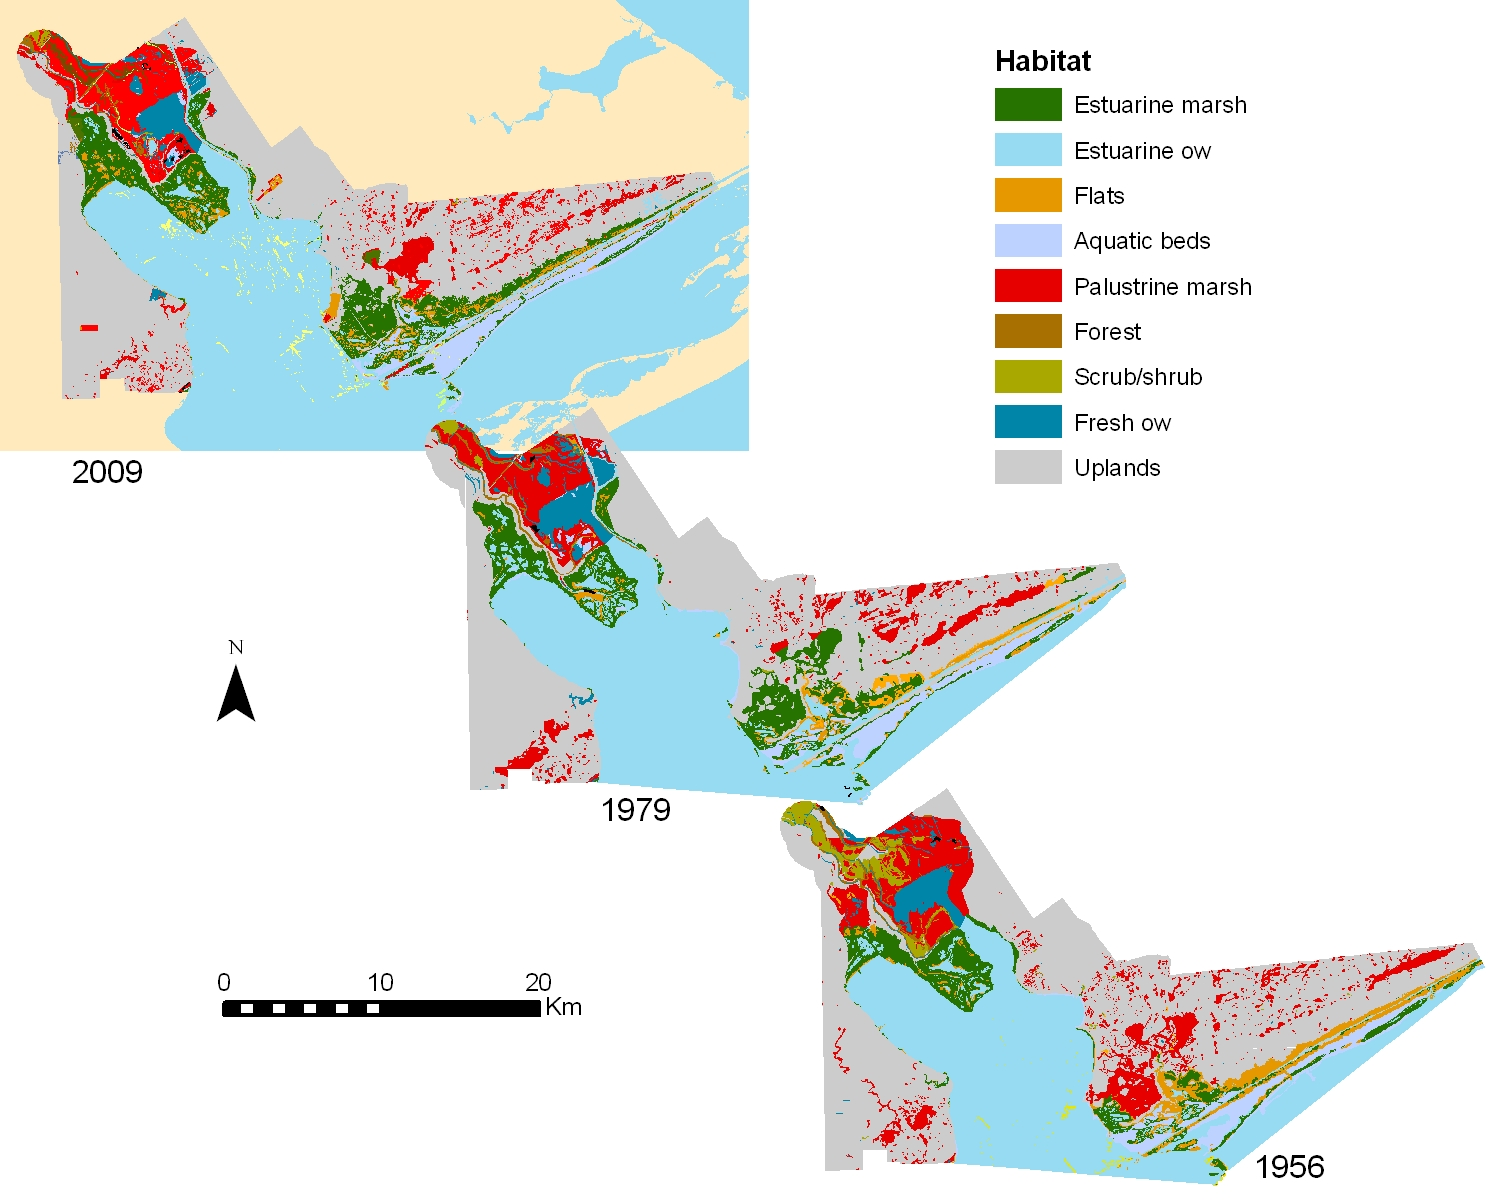
Figure 3. Maps showing distribution of major wetland and aquatic habitats in 2009, 1979, and the 1950’s in the San Antonio Bay study area.
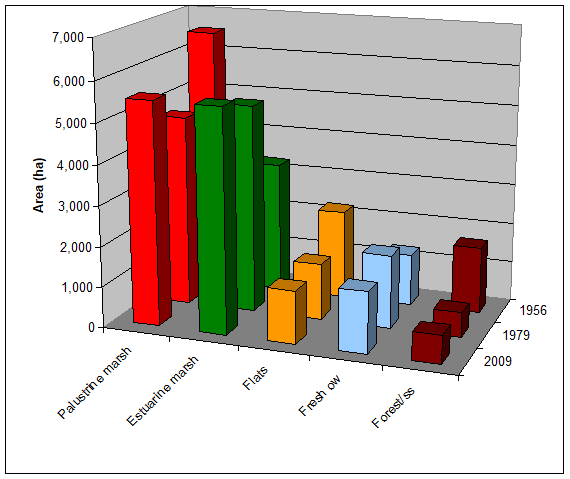
Figure 4. Areal extent of selected habitats from the 1950’s through 2009 in the San Antonio Bay study area. Palustrine marsh is the most extensive habitat. Estuarine marsh is also widely distributed in the study area