
Beach Processes Meaurements
Tracking the topography of the beach shows us how the beach changes, but measuring the wind and waves will help us understand why the beach changes. The process measurements you make during your beach visits are just a snapshot of what is going on in terms of wind, waves, and currents. What is really pertinent about the state in which you find the beach, however, is what has been happening for some period of time (hours to months) before your arrival. Unless you obtain process measurements every day, you will not be able to collect enough data to properly relate your measurements to your beach profiles. Fortunately there are many areas where instruments area already acquiring hourly data on wind and waves.
The National Oceanic and Atmospheric Administration (NOAA) operates weather, current, and wave stations around the U.S. coasts. Although these stations will not likely be at your beach-profile location, however, you can use the measurements you make to determine the differences in measurements between your location and the continuously operated stations. After you have enough simultaneous measurements, you will be able to calibrate the continuous data for your beach location. For example, if your wave-height measurements are consistently higher than those obtained by an offshore gauge you will know to increase the wave-height measurements at the offshore gauge before applying the data to your beach location. Similarly if the wind direction at a weather station is consistently more out of the north than at your location or the speed is higher, then you know how to correct these data for your location.
There is another reason to make careful measurements of the processes. It is simply so that you can hone your powers of observation and increase your appreciation of the physical processes shaping the beach environment. Because the techniques here are qualitative, three people will make estimates to provide more reliable data. Following are measurements to employ.
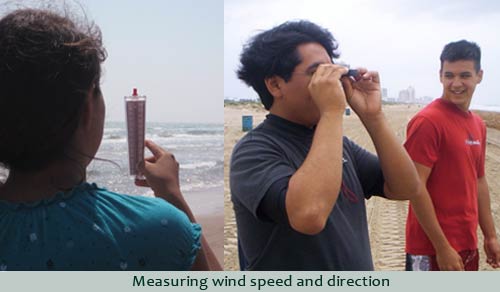
Wind Direction and Speed
a) Go to a high point in the area of the beach profile: the foredune crest or on top of a seawall would do fine. Make sure you are not shielded from the wind in any direction.
b) Face directly into the wind by feeling it on your face. Without moving your head, raise the sighting compass and determine the bearing pointing into the wind. Record this magnetic bearing.
c) Face directly into the wind and hold the Dwyer wind meter to the wind. Hold the meter upright with the two holes on the bottom directly into the wind. Read the level at which the ball is suspended. If the ball is at the top, place your forefinger over the top hole and read from the high-range scale. Maneuver the meter so that the highest readings are obtained. This is how you know whether you have it pointed directly into the wind.
d) Watch the wind meter for about 1 min and determine the sustained wind speed. The sustained wind speed does not include sudden gusts or short calm periods of wind.
e) Determine and record the highest wind-gust speed during this time.
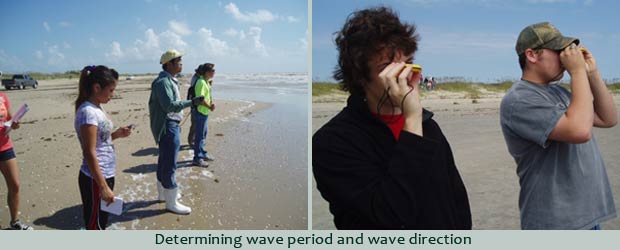
Wave Direction
a) From the same point that you determined the wind direction and speed, determine the direction from which the waves are coming.
b)Look across the breaker zone and focus on the waves where they first break. Turn your head so that you are looking directly into the oncoming waves. Raise your sighting compass and determine the bearing directly into the waves. Record this magnetic bearing. When sighting on the breakers, you may find it helpful to align the horizontal edge of the compass so that it is parallel to the breaker line.
c)It is important to focus on the waves where they first break offshore and not on the waves near the beach.
d)Keep your wave-direction measurement secret and pass the sighting compass to the second and then the third observer for their determinations.
e) All observers should record their observations in the places that correspond to their observer numbers as written on the top of the form.
Wave-breaker height
a) Move to the waterline and estimate the height of the breaking waves when they first break offshore. Moving to the waterline gives you a better perspective for estimating height.
b) Record your estimate in centimeters on the data form.
Wave period
a)Focus on an imaginary point in the middle of the surf zone. You will count the waves passing this unmoving point for 10 seconds.
b)As the crest of a wave passes your point, count that as zero and start your stopwatch. The next wave is wave #1.
c)When the 10th wave passes your point, stop the watch.
d)Divide the number of seconds by 10 to get the wave period. Don’t forget to convert minutes of time to seconds before you divide.
e)Record your estimate in seconds on the data form.
Surf-zone Width
a) While standing at the waterline, estimate the width of the surf zone. This is the distance from the waterline out to where the waves first break. Record your estimate in meters on the data form. You should keep in mind that most people tend to underestimate distances across water.
Number of Longshore Bars
a) Estimate the number of apparent longshore bars by counting the number of breaker lines or visible shallow zones oriented parallel to the beach.
Wave Breaker Type
Waves break in different ways depending on the wavelength, wave height, and slope of the surf zone. When the crests of waves curl and suddenly collapse, they are said to be plunging. These are the types of waves surfers crave. When the crest continuously breaks as the wave moves onshore, it is said to be spilling. Surging waves push up the shore and slosh onto the beach without an orderly breaking of the crest. Surging breakers are rare, and along the Texas coast, will generally only occur where seawalls are in the surf zone.
a) Observe the outermost breakers and record the breaker type as plunging, spilling, or surging. Make sure you record the outermost breaker type. Along shorelines with nearshore bars, spilling-type breakers will almost always be present landward of the outer breakers so don’t confuse these breakers with what is occurring where the waves first break. There is often a mixture of plunging and spilling types, but you must decide which is the dominant type and check only one on the form.
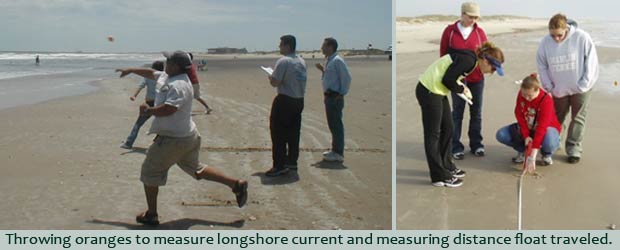
Longshore Current
The longshore current, the movement of water along the shoreline, is caused by (1) waves approaching at an angle to the shoreline, (2) tidal currents, and (3) wind. You will measure the speed and direction of the current using a float that you throw into the surf zone. a) You need a float that you can throw at least 30 m and that has a low profile to the wind when it is in the water. A low profile is important because our intent is to measure the water current, not the wind direction and speed. A rubber or hard plastic ball about the size of a baseball and that has some weight to it makes a good float. You also need a stopwatch.
b)Go to the water line and throw the float into the middle of the surf zone or as far as you can if you cannot reach the midsurf zone.
c)Step back up the beach and, with your heel, mark a line in the sand at the position of the ball and start the stopwatch.
d)Walk along the beach following the ball as it moves along the shore. Do not take your eyes off the ball. After 50 seconds, mark another line in the sand.
e)Record the distance from the waterline at which you initially threw the float. This is useful information because your results may vary with this distance.
f)Measure in meters the distance the ball moved along the beach.
g)Multiplying the distance by 2 gives the speed of the longshore current in centimeters per second. Record the speed and direction the float moved on the form.
h) Repeat b through g two more times.


.png)

