Powderhorn Ranch Geoenvironmental Atlas
Geology and Geophysics
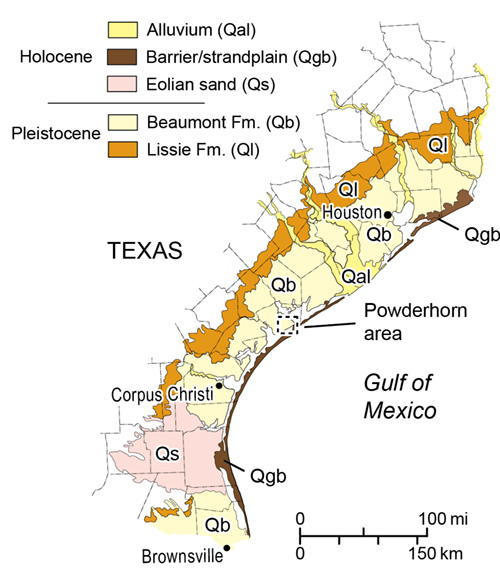
Figure G1. Quaternary geologic units of the Texas Coastal Plain. Modified from the Geologic Atlas of Texas.
The Texas Coastal Plain is underlain by a complex assemblage of fluvial, deltaic, estuarine, and marine-influenced deposits that make up two Pleistocene formations (fig. G1): the younger Beaumont Formation and the older Lissie Formation (Hays and Kennedy, 1903; Sellards and others, 1932; Price, 1934, 1958; Metcalf, 1940; Doering, 1956; Aronow, 1971). These two formations record depositional, erosional, and weathering events associated with more than 20 full or partial glacial-interglacial cycles recorded in ice and sediment cores worldwide (Shackleton and Opdyke, 1973, 1976; Imbrie and others, 1984; Lorius and others, 1985; Robin, 1985; Lisiecki and Raymo, 2005). These strata have previously been mapped at a regional scale (1:250,000) as part of the Geologic Atlas of Texas series published by the BEG, and also have been mapped at 1:125,000 scale as part of the Environmental Geologic Atlas of the Texas Coastal Zone published by the BEG.
Two geologic units are mapped at Powderhorn Ranch on the 1:250,000-scale Geologic Atlas of Texas map (Brown and others, 1975). Most of the ranch is shown to be underlain by Beaumont Formation barrier island and beach deposits (map unit Qbb) consisting mostly of fine-grained sand with scarce shell. The surface is slightly higher than the surrounding deposits and is characterized by numerous pimple mounds and relict beach ridges. Pimple mounds (fig. G2), or low mounds of sand that can be tens of meters in diameter and a meter or more high, are common on Powderhorn Ranch. The map unit is interpreted as part of the Ingleside barrier system and is less than 20 m thick (Brown and others, 1975). The Ingleside system is a series of late Pleistocene barrier island and strandplain segments that stretches discontinuously from south of Corpus Christi Bay to Matagorda Bay. Powderhorn Ranch is the northernmost segment of four that are separated by Corpus Christi Bay, Aransas Bay, and San Antonio Bay. Minor alluvial units (Qal) are mapped on Powderhorn Ranch along Powderhorn Lake and Matagorda Bay (Brown and others, 1975). At a somewhat finer scale, the Environmental Geologic Atlas (McGowen and others, 1976) depicts Powderhorn Ranch as mostly tree- or grass-covered sand in a barrier-strandplain system. Mud-filled swales are mapped between beach-ridge complexes.
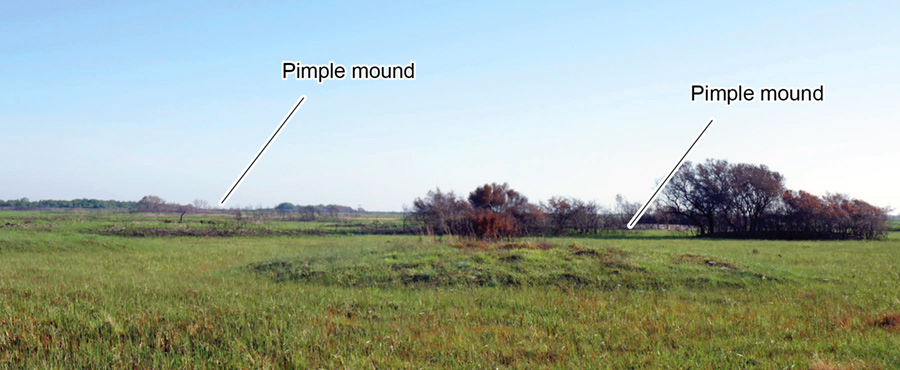
Figure G2. Pimple mounds on sandy Ingleside barrier system deposits on Powderhorn Ranch.
High-resolution, lidar-derived topographic maps, recent aerial imagery, field studies, and surface and borehole geophysical measurements have been used to conduct new geologic mapping in the Powderhorn Ranch area at the 7.5-minute quadrangle (1:24,000) scale (Paine and Collins, 2016a,b; Paine and Collins, 2017a,b,c,d). These maps have been merged to create a geologic map of Powderhorn Ranch (fig. G3). Principal geologic units recognized in the map area include Pleistocene units of the Beaumont Formation (sandy deposits of the Ingleside barrier system ridge complexes, sandy and muddy deposits of the intervening swales, and clayey or sandy fluvial and deltaic deposits landward of the Ingleside barrier in the northwest part of the mapped area). Holocene units include bay margin sand and mud, sand and clay alluvial deposits along drainages, sandy and muddy tidal flat deposits, sandy and shelly beaches and spits along the Matagorda Bay and Powderhorn Lake shorelines, ephemeral lake basin sand and mud deposits, and wind-blown sands in widespread sheet deposits and local dunes.
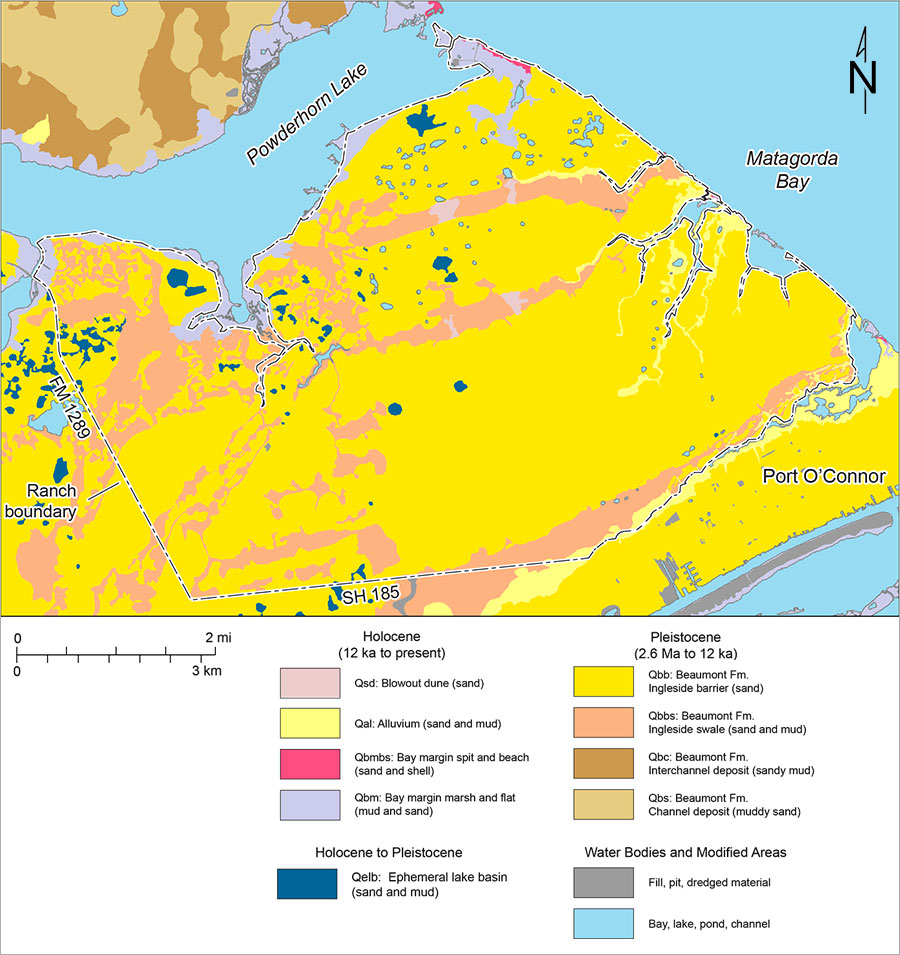
Figure G3. Geologic map of Powderhorn Ranch. Modified from Paine and Collins (2016a,b; Paine and Collins, 2017a,b,c,d).
Eroding low bluffs along Matagorda Bay and Powderhorn Lake expose the shallowest of these deposits. Along Matagorda Bay, Ingleside barrier and lagoonal sands and muddy sands have well-developed soil horizons and common piping features (fig. G4). These strata are overlain by a sheet of well-sorted, wind-blown sand with little soil development. Optical luminescence dates obtained on the Ingleside deposits yielded ages of 72 to 83 ka (plus or minus about 15 ka). The younger eolian sheet sands yielded ages of 4.9 to 6.5 ka (plus or minus about 1 ka). Dates are pending for additional samples collected along Matagorda Bay in 2018. The Ingleside dates are consistent with deposition during the last interglacial sea-level highstand series between 80 and 120 ka (oxygen isotope stage 5).
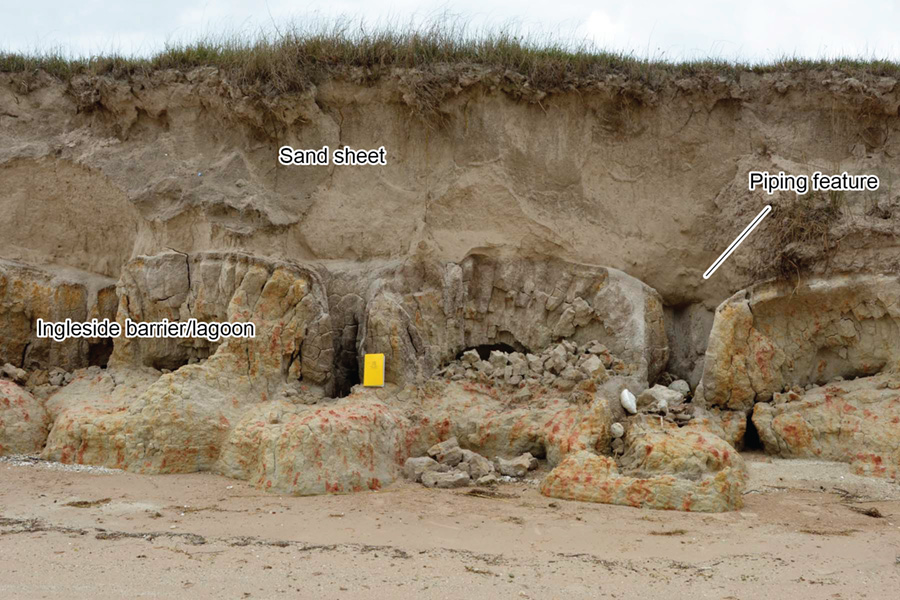
Figure G4. Exposure of Pleistocene Ingleside barrier system sand and mud with soil features overlain by Holocene eolian sheet sand along Matagorda Bay. Piping features are common in these sand-rich strata.
Given the low relief and limited exposures on the Texas coastal plain in general and Powderhorn Ranch specifically, other approaches must be used to gather information about the shallow subsurface lithologic and hydrologic conditions. Geophysical methods used at Powderhorn Ranch to explore below the surface included (a) borehole geophysical logging of 19 water wells (figs. G5 and G6) that revealed detailed information about the vertical changes in lithology and water quality to maximum well depths ranging from 59 to 97 m and (b) 8 time-domain electromagnetic induction (TDEM) soundings (figs. G5 and G7) that provided generalized electrical conductivity profiles to maximum depths of 132 to more than 200 m.
Borehole logging at Powderhorn Ranch included natural gamma and electrical conductivity logs. Gamma logs record the natural radioactivity (gamma rays) emitted by strata surrounding the well and are used to examine lithologic variations. Pleistocene Beaumont Formation strata in the shallow subsurface beneath Powderhorn Ranch consist of a series of more- and less-clay rich units whose sharp or gradational contacts can be determined from gamma logs. Clays tend to contain minerals having higher gamma-ray count rates, whereas sands tend to contain minerals having low gamma-ray count rates.
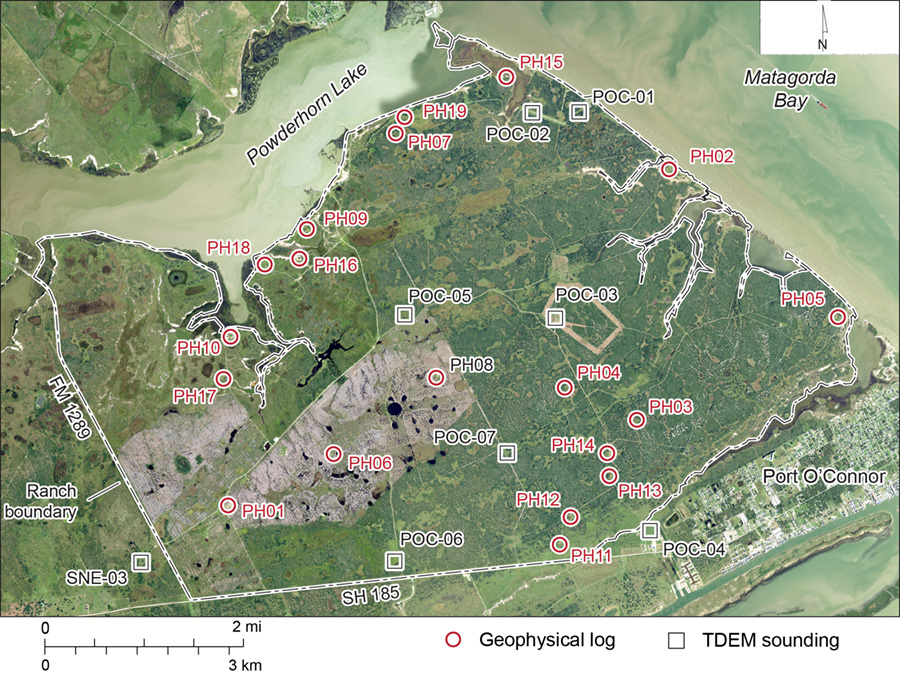
Figure G5. Location of logged wells and time-domain electromagnetic induction (TDEM) soundings on Powderhorn Ranch..
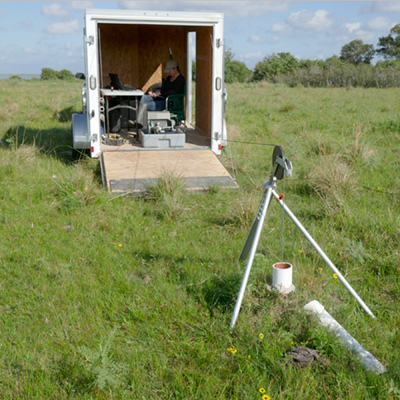
Figure G6. Geophysical logging at water well PH19 along Powderhorn Lake, May 16, 2018.
A gamma log from well PH05 (figs. G5 and G8) illustrates how gamma activity varies from the ground surface to the bottom of the well at about 87 m. The low count rates (about 10 counts/s) at the left of the log correspond to sandy strata; the higher count rates (about 30 counts/s) at the right of the log correspond to clayey strata. The patterns evident in the log include both gradual changes in count rates (interpreted as a gradual change in clay content) as well as abrupt changes in count rates (interpreted as sharp boundaries between depositional units). The gamma log for well PH05 can be interpreted to show a series of depositional units that transition from fluvial environments (point bar and flood plain) below 30 m depth, to a coarsening-upward deltaic environment between 20 and 30 m depth, and finally marine-influenced environments (bay or estuarine and barrier island) in the upper 20 m. The sandy unit above 10 m depth is the Ingleside barrier system. Similar patterns occur in many of the Powderhorn Ranch wells.
Electrical conductivity logs also respond to lithologic changes. All other factors being equal, measured electrical conductivity is higher for clayey strata than it is for sandy strata. Comparisons of gamma activity and conductivity logs from Powderhorn Ranch generally show similar trends (fig. G9). High electrical conductivities are measured where gamma counts (and clay content) are high. Where there are exceptions, it is commonly because there are changes in water saturation or pore-water salinity. For example, sandy strata saturated with more saline ground water can be identified where gamma counts are low (indicating sand), yet conductivities are high (indicating saturation with saline water). Conversely, saturated stratal zones with both low gamma and low conductivity values can indicate sandy units saturated with relatively fresh ground water.
TDEM soundings can supplement data from well logs in places where there are no wells to log. The 8 soundings on and near Powderhorn Ranch (fig. G5) produced conductivity profiles that extend deeper than the Powderhorn Ranch water wells but are less detailed. For example, the conductivity profile for sounding POC-04 (fig. G10) reaches depths greater than 200 m. It shows a low-conductivity zone from the surface to a depth of about 11 m. This zone correlates to the low gamma count and low conductivity zone present in many of the well logs and represents the sandy core of the Ingleside barrier system.
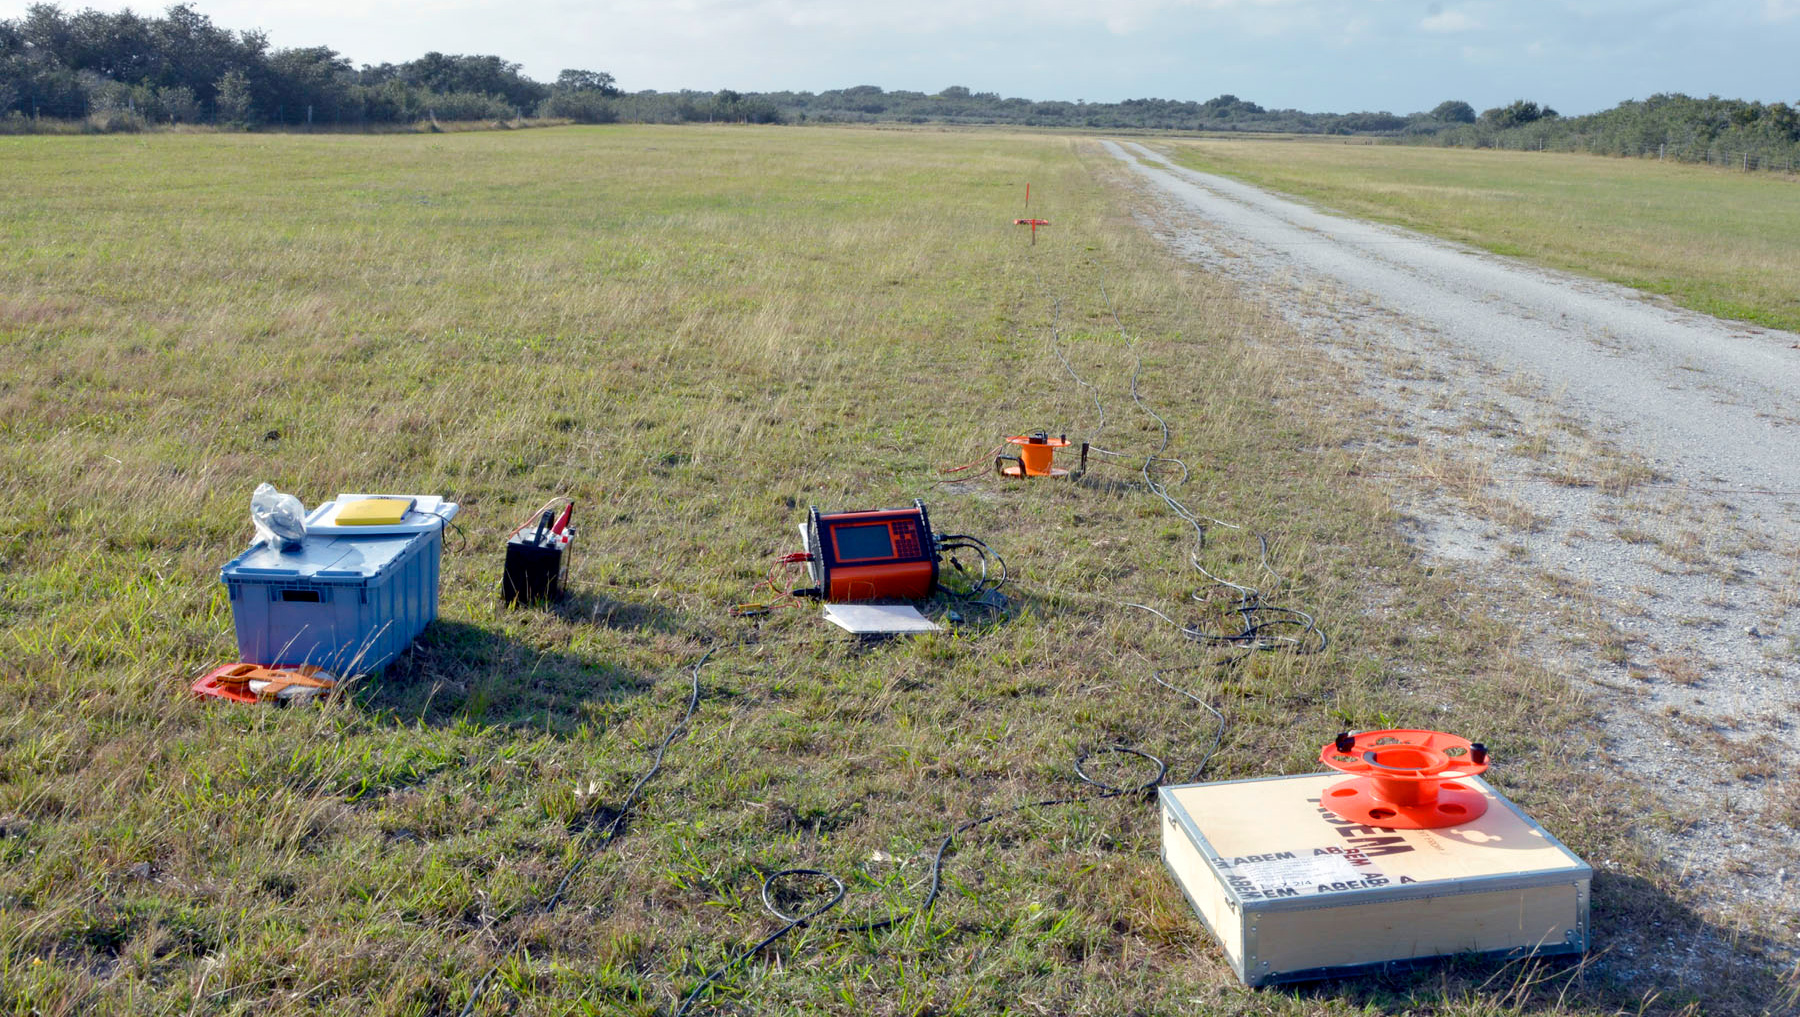
Figure G7. Equipment laid out for TDEM sounding POC-02, November 11, 2015.
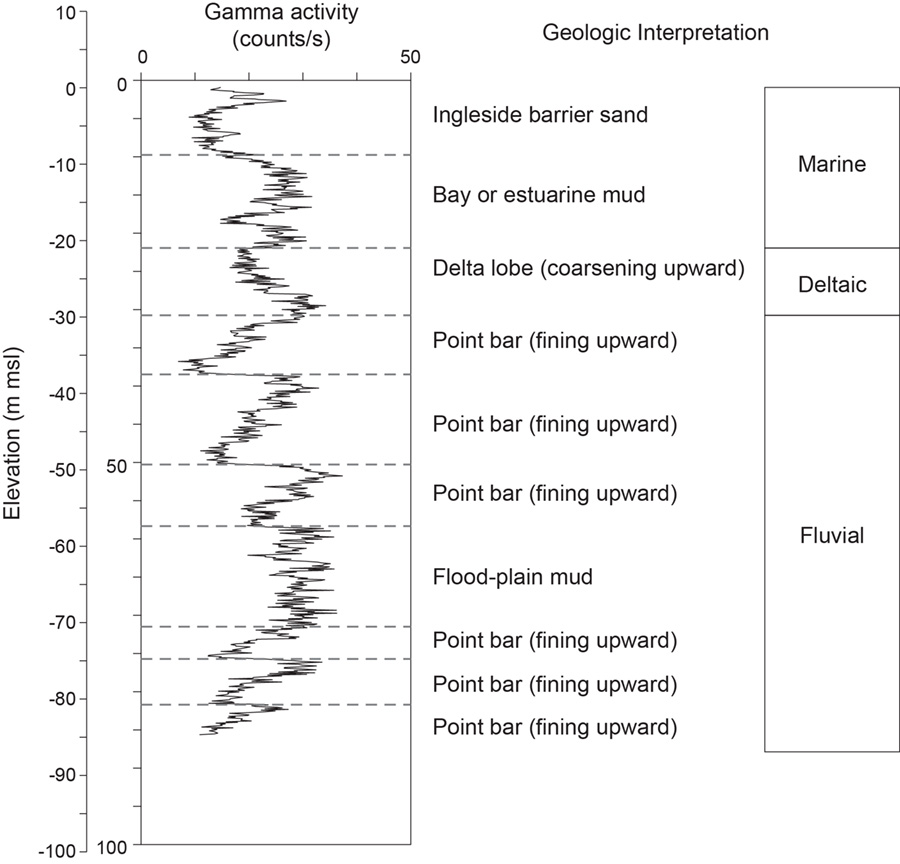
Figure G8. Gamma activity log for well PH05.
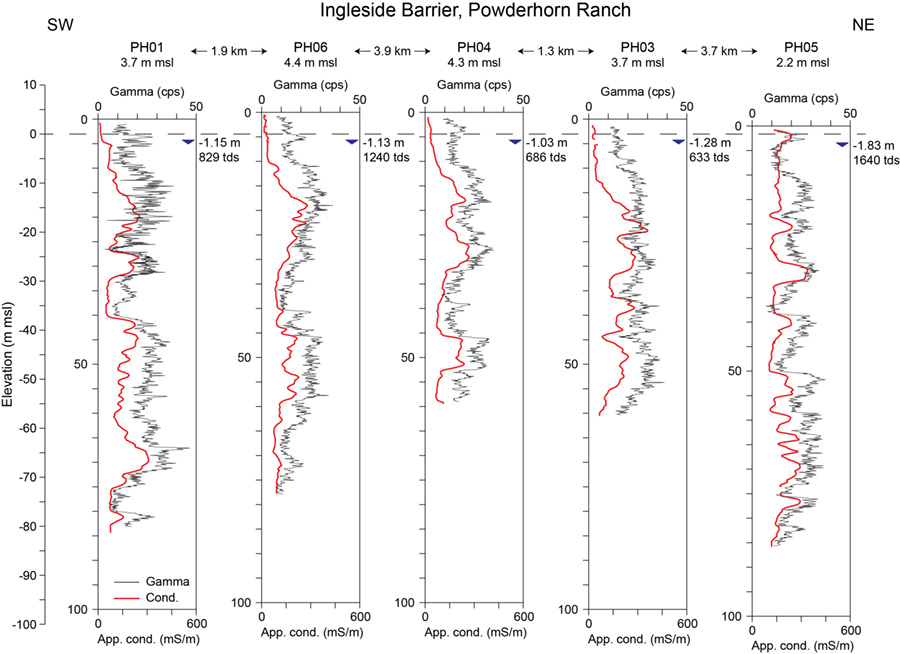
Figure G9. Well log cross section oriented southwest to northeast across Powderhorn Ranch showing gamma and conductivity logs from wells PH01, PH06, PH04, PH03, and PH05. Also shown are measured water levels and total dissolved solids concentration estimated from water samples.
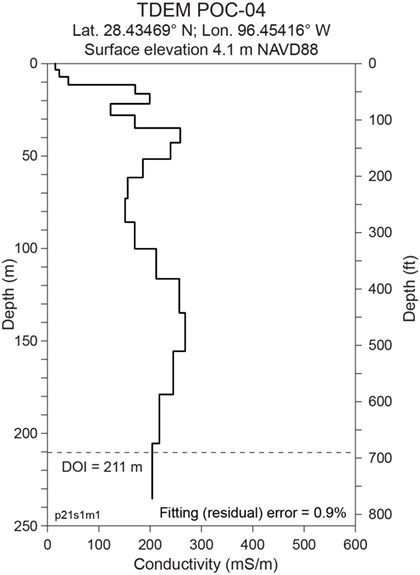
Figure G10. Subsurface electrical conductivity model constructed from TDEM sounding POC-04.
The information from well logs and TDEM soundings can be combined to determine the thickness of the Ingleside barrier system sands across Powderhorn Ranch. These data indicate that the Ingleside barrier system sands are 8 to 11 m thick (fig. G11).
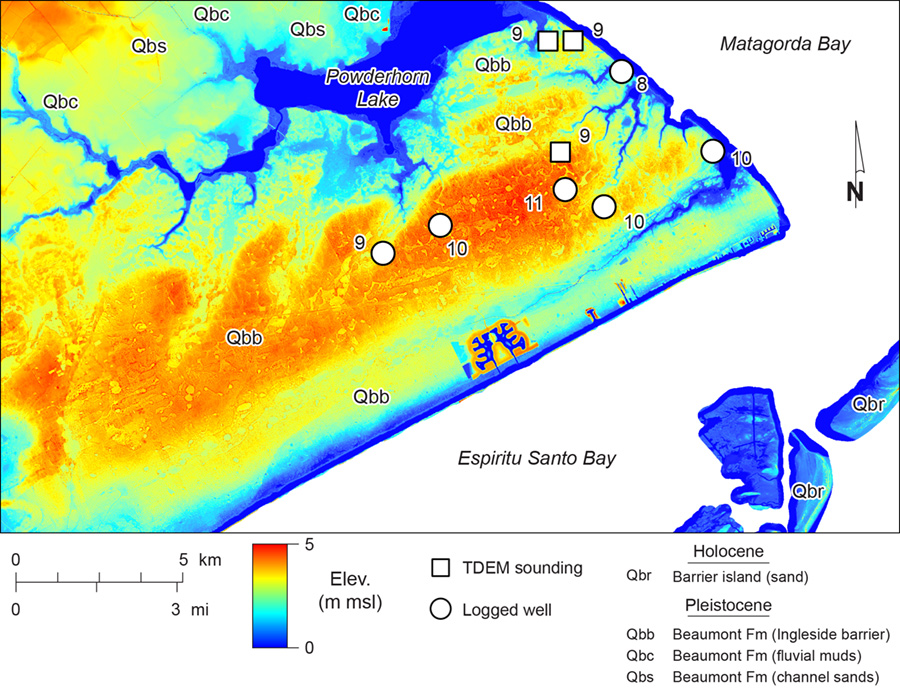
Figure G11. Thickness of the Ingleside barrier system sand determined from selected geophysical logs and TDEM soundings on and near Powderhorn Ranch. Thicknesses are superimposed on topography from a 3-m grid cell lidar survey conducted by the U. S. Geological Survey in 2011.
References
Aronow, S., 1971, Nueces River delta plain of Pleistocene Beaumont Formation, Corpus Christi region, Texas: American Association of Petroleum Geologists Bulletin, v. 55, p. 1231-1248.
Brown, T. E., Brewton, J. L., McGowen, J. H., Proctor, C. V., Aronow, S., and Barnes, V. E., 1975, Geologic Atlas of Texas, Beeville-Bay City Sheet: The University of Texas at Austin, Bureau of Economic Geology, Geologic Atlas Sheet, map scale 1:250,000.
Hayes, C. W., and Kennedy, W., 1903, Oil fields of the Texas-Louisiana gulf coastal plain: U.S. Geological Survey Bulletin 212, 174 p.
Imbrie, J., Hays, J. D., Martinson, D. G., McIntyre, A., Mix, A. C., Morley, J. J., Pisias, N. G., Prell, W. L., and Shackleton, N. J., 1984, The orbital theory of Pleistocene climate: support from a revised chronology of the marine 18O record: in Milankovitch and Climate, Part I, New York, Springer, p. 269-305.
Lisiecki, L. E., and Raymo, M. E., 2005, A Pliocene-Pleistocene stack of 57 globally distributed benthic d18O records: Paleoceanography, v. 20, 17 p..
Lorius, C., Jouzel, J., Ritz, C., Merlivat, L., Barkov, N. I., Korotkevich, Y. S., and Kotlyakov, V. M., 1985, A 150,000-year climatic record from Antarctic ice: Nature, v. 316, p. 591-596.
Metcalf, R. J., 1940, Deposition of Lissie and Beaumont Formations of Gulf Coast of Texas: American Association of Petroleum Geologists Bulletin, v. 24, p. 693-700.
McGowen, J. H., Proctor, C. V., Jr., Brown, L. F., Jr., Evans, T. J., Fisher, W. L., and Groat, C. G., 1976, Environmental Geologic Atlas of the Texas Coastal Zone - Port Lavaca Area: The University of Texas at Austin, Bureau of Economic Geology, Environmental Geologic Atlas EA0007, 107 p.
Paine, J. G., and Collins, E. W., 2016, Geologic map of the Port O’Connor Quadrangle, Texas Gulf of Mexico Coast: Sheet 1: The University of Texas at Austin, Bureau of Economic Geology, Open-File Map, 1:24,000.
Paine, J. G., and Collins, E. W., 2016, Geologic map of the Port O’Connor Quadrangle, Texas Gulf of Mexico Coast: Sheet 2, Geophysical logs and time-domain electromagnetic induction soundings: The University of Texas at Austin, Bureau of Economic Geology, Open-File Map, 1:24,000.
Paine, J. G., and Collins, E. W., 2017, Geologic map of the Port Lavaca East Quadrangle, Texas Gulf of Mexico Coast: The University of Texas at Austin, Bureau of Economic Geology, Open-File Map, no. 0233, 1:24,000.
Paine, J. G., and Collins, E. W., 2017, Geologic map of the Port Lavaca East Quadrangle, Texas Gulf of Mexico Coast, Sheet 2, Digital elevation model, time-domain electromagnetic induction sounding, and frequency-domain electromagnetic induction measurements: The University of Texas at Austin, Bureau of Economic Geology, Open-File Map, no. 0233.
Paine, J. G., and Collins, E. W., 2017, Geologic map of the Seadrift NE Quadrangle, Texas Gulf of Mexico Coast: The University of Texas at Austin, Bureau of Economic Geology, Open-File Map, no. 0232, 1:24,000.
Paine, J. G., and Collins, E. W., 2017, Geologic map of the Seadrift NE Quadrangle, Texas Gulf of Mexico Coast, Sheet 2, Digital elevation model geophysical logs, time-domain electromagnetic induction soundings, and frequency-domain electromagnetic induction measurements: The University of Texas at Austin, Bureau of Economic Geology, Open-File Map, no. 0232.
Price, W. A., 1934, Lissie formation and the Beaumont clay in south Texas: American Association of Petroleum Geologists Bulletin, v. 18, p. 948-959.
Price, W. A., 1958, Sedimentology and Quaternary geomorphology of south Texas, in Gulf Coast Association of Geological Socieites Transactions, v. 8, p. 41-75.
Robin, G. d. Q., 1985, Contrasts in Vostok core — changes in climate or ice volume?: Nature, v. 316, p. 578-579.
Sellards, E. H., Adkins, W. S., and Plummer, F. B., 1932, The geology of Texas, Volume I: stratigraphy: The University of Texas, Austin, Bulletin 3232, 1007 p.
Shackleton, N. J., and Opdyke, N. D., 1973, Oxygen isotope paleomagnetic stratigraphy of equatorial Pacific core V28–238: oxygen isotope temperatures and ice volumes on a 105 and 106 year scale: Quaternary Research, v. 3, p. 39-55.
Shackleton, N. J., and Opdyke, N. D., 1976, Oxygen-isotope and paleomagnetic stratigraphy of Pacific core V28–239: late Pliocene to latest Pleistocene: Geological Society of America Memoir 145, p. 449-464.