Galveston Shorelines
Shorelines are the dynamic boundary between land and water. The Bureau maintains a digital database that contains numerous shoreline positions for the Gulf of Mexico coastline and select Texas bays that are used to calculate rates of shoreline change. These shorelines come from numerous sources including photography, GPS, and lidar. Shorelines used in older Bureau studies were mapped directly on aerial photomosaics (quadrangles) then optically transferred to 1:24,000 scale, 7.5-minute USGS topographic base maps (Caudle and Paine, 2024; Paine, Caudle, and Andrews, 2021). With the advent of ArcGIS, those paper maps were scanned to create a digital file, then imported into ArcGIS, georeferenced in NAD27 (datum of the USGS topographic maps), and transformed into the NAD83 coordinate system. The shoreline positions were then digitized in ArcGIS. The 1995, 2007, parts of the 2016, 2020, and 2022 shorelines were mapped digitally within GIS by digitizing the wet beach/dry beach boundary as depicted on high-resolution, georeferenced aerial photographs. The 1996 Gulf shoreline was surveyed using differentially corrected GPS data acquired from a GPS receiver mounted on a motorized vehicle. Shoreline positions were extracted from lidar data collected in 2000, 2010-2012, parts of 2016, and 2019.
For this project, the original paper maps were again scanned at 600 dpi to create a digital image, georeferenced in NAD27, and transformed into the NAD83 coordinate system. The shoreline positions on the paper maps were compared with the shorelines that were contained in the Bureau database. In some instances, particularly along the bay shorelines, positions were revised if they did not match with the database. In other instances, older shorelines that were notated on the paper maps were not included in the digital database. They were digitized and added to the data for the park. The georeferenced 1930 and 1956 photos were also used to verify shoreline positioning. In areas where there were differences between the paper maps and the georeferenced photographs, the shoreline position from the photomosaics were digitized in ArcGIS. By using directly georeferenced imagery, errors can be eliminated that can be introduced through the transfer to paper maps, georeferencing in the older NAD27 coordinate system, and transformation to the newer NAD83 coordinate system.
Galveston Island State Park has approximately 2.6 km of Gulf of Mexico shoreline. These shorelines are highly susceptible to erosion by non-storm waves, storm surge and storm waves, and relative sea level rise. The West Bay shoreline in Galveston Island State Park is characterized by back-barrier marsh and tidal flats. Bay-margin marshes and tidal flats have low elevation, minimal slope, muddy sand or sandy mud substrate, and dominant marsh vegetation with interspersed tidal flats. These shorelines are highly susceptible to erosion by non-storm waves and to land loss by submergence related to relative sea level rise. They have a low susceptibility to erosion related to storm surge and storm waves because they are inundated before storm passage. The position of the bay shoreline has experienced significant erosion between the 1850s and 2022.
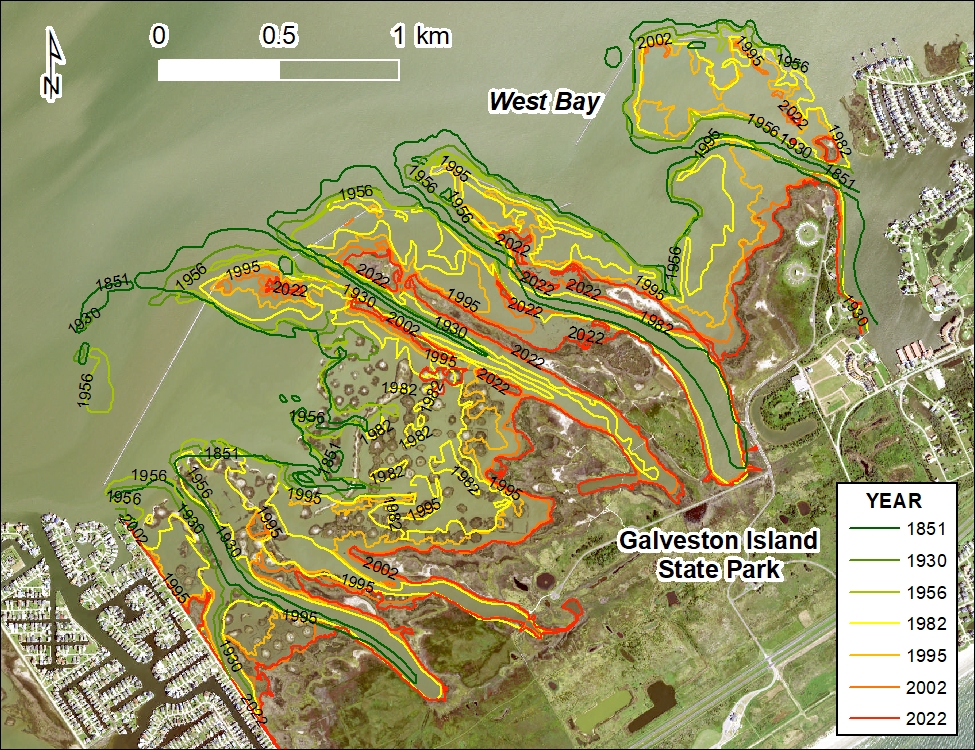
Figure 1. Position of West Bay margin shorelines in Galveston Island State Park between 1851 and 2022. The 2022 shoreline position is mapped along the continuous coastline. It does not include the shoreline positions around the wetland restoration marsh mounds.
Shoreline Movement
Texas coastal shorelines include bay and Gulf of Mexico frontage along the barrier islands and mainland shores. In Galveston Island State Park, these shorelines include Gulf beaches, marshes, tidal flats, and bay beaches. Common coastal processes that include wind-driven waves, storm surge and storm waves, and relative sea-level rise contribute to the dynamic nature of these coastal boundaries, leading to shoreline retreat or advance through removal or addition of sediment, or by submergence and emergence. It is important to monitor the movement of these coastal boundaries, determine coastal land loss and gain, and characterize shoreline movement and its potential impact on the varied activities, uses, and functions of coastal land, vegetation, and habitat.
Bureau researchers conduct studies that update rates of shoreline movement; characterize shoreline types; and access shoreline vulnerability to sea-level rise, non-storm waves, and storm surge and waves. The most recent update to Gulf of Mexico shoreline movement for the entire Texas coast was completed through 2019 (Paine, Caudle, and Andrews, 2021). The Galveston Bay system (including West Bay) was the subject of a recently completed study that determined longer-term net movement rates by comparing shoreline positions from 1930 and 1956 with those from 2022, and a more recent net shoreline movement rate by comparing shoreline positions from 1982 to those from the 2022 data (Caudle and Paine, 2024). For this project, long-term and short-term Gulf shoreline change rates were calculated based upon the shorelines assembled for this project. The bay shoreline movement rates included in the data viewer are from the Galveston Bay study (Caudle and Paine, 2024).
Calculating rates of shoreline movement starts with importing shorelines into an ArcGIS geodatabase, then creating a baseline from which to cast shore-parallel transects using the GIS-based extension software Digital Shoreline Analysis System (DSAS v. 5.1; Himmelstoss and others, 2021). Transects were cast at 25-m intervals along Gulf of Mexico shorelines and 50-m intervals along the bay shoreline. Rates of change and associated statistics for the 1934 to 2022, 1956 to 2022, and 2000 to 2022 periods were calculated using the transect locations and the selected shorelines for the Gulf shoreline. Rates of change and associated statistics for the 1930-2022, 1956-2022, and 1982-2022 periods were calculated for the bay shorelines. The intersection of the transect lines with the latest shoreline was used to create GIS shape files containing the rates, statistics, and period of shoreline change measurements and the measurement transects bounded by the most landward and seaward historical shoreline position for each measurement site. For additional information and details regarding Texas Gulf and bay shorelines and calculating shoreline change rates, see Paine, Caudle, and Andrews, 2021; Caudle and Paine, 2024; as well as the Bureau’s Texas shoreline change websites (https://www.beg.utexas.edu/research/programs/coastal/the-texas-shoreline-change-project or https://www.beg.utexas.edu/research/programs/coastal/texas-bay-shoreline-change).
Shoreline change rates for the Gulf of Mexico coast in Galveston Island State Park averages retreat (moving landward) at 1.37 m/yr (4.48 ft/yr) between 1934 and 2022. Between 1956 and 2022 that rate increases to 1.51 m/yr (5 ft/yr) of retreat (Fig. 2). For the most recent monitoring period, 2000 to 2022, the shoreline retreated at a much lower rate, 0.14 m/yr (0.5 ft/yr). According to the most up-to-date movement calculations for the entire Texas Gulf of Mexico shoreline (from Sabine Pass at the Texas/Louisiana border to the Rio Grande at the Texas/Mexico border), the average rate over the longer-term monitoring period (1930s to 2019) is retreat at 1.27 m/yr (4.2 ft/yr), over the intermediate-term monitoring period (1950s to 2019) is retreat at 1.42 m/yr (4.7 ft/yr), and for most recent, short-term monitoring period (2000 to 2019) is retreat at 1.25 m/yr (4.1 ft/yr) (Paine, Caudle, and Andrews, 2021). For these same time periods, Galveston Island shorelines retreated at a low net rate of 0.21 m/yr (0.7 ft/yr) between the 1930s and 2019, averaged a higher rate of retreat of 0.61 m/yr (2 ft/yr) between the 1950s and 2019, but averaged short-term net rates of advance of 0.77 m/yr (2.5 ft/yr) between 2000 and 2019 (Paine, Caudle, and Andrews, 2021). The shoreline in the state park showed higher rates of retreat in both of the longer-term and intermediate time periods than both the Texas coast and Galveston Island. For the most-recent time period, the state park shoreline was stable compared to the average advancement for the whole island and a retreat rate for the entire Texas coast that was similar to the long-term rate.
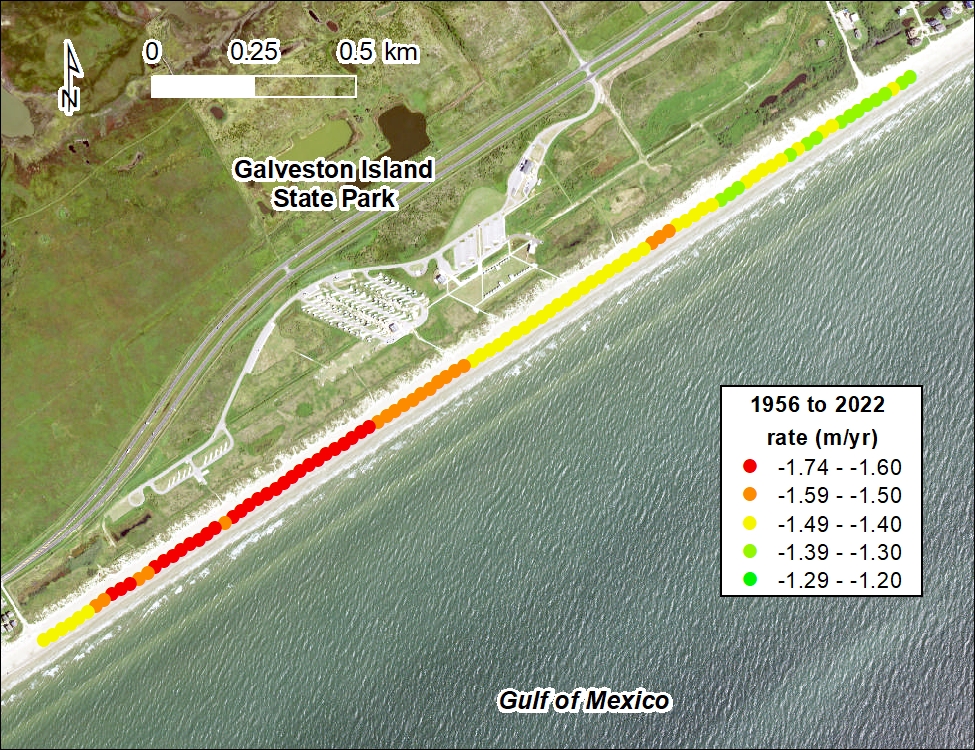
Figure 2. Net rate of intermediate-term movement for the Gulf of Mexico shoreline in Galveston Island State Park calculated from shoreline positions from 1956 and 2022.
Shoreline change rates for the West Bay coastline in Galveston Island State Park was dominantly erosional over the three monitoring time periods. The back-barrier island shoreline averaged retreat (moving landward) at 4.28 m/yr (14 ft/yr) between 1930 and 2022. Between 1956 and 2022 the retreat rate increased to 6 m/yr (19.4 ft/yr), and for the most recent monitoring period (2000 to 2022) the shoreline retreated at 7.6 m/yr (25 ft/yr, Fig. 3). This trend mirrored the increasing retreat rates for each monitoring period for the entire Galveston Bay system—which includes Galveston, Trinity, East, and West Bays—although at much lower rates (Caudle and Paine, 2024). During the longest time period, 1930 to 2022, 83% of the measurement sites retreated at an average rate of 0.78 m/yr (2.56 ft/yr). Between 1956 and 2022, 82% of sites retreated at an average rate of 0.99 m/yr (3.25 ft/yr). During the more recent period (1982 to 2022), net shoreline retreat averaged 1.05 m/yr (3.45 ft/yr) for the Galveston Bay system. Along the back-barrier shoreline of Galveston Island shorelines retreated at 1.27 m/yr (4.2 ft/yr) during the longest-term 1930-2022, 2.07 m/yr (6.8 ft/yr) during the intermediate-term of 1956 to 2022, and 1.99 m/yr (6.5 ft/yr) between 1982 and 2022. While the trend in shoreline movement in the entire Galveston Bay system is erosional, with increasing rates of retreat as the monitoring periods get shorter, the shoreline retreat rates in Galveston Island State Park are exceptionally high. This is due to rising sea level flooding the low-lying bay margin environments and the lack of armoring in the state park. The adjacent shorelines have been heavily modified to decrease land loss in those communities.
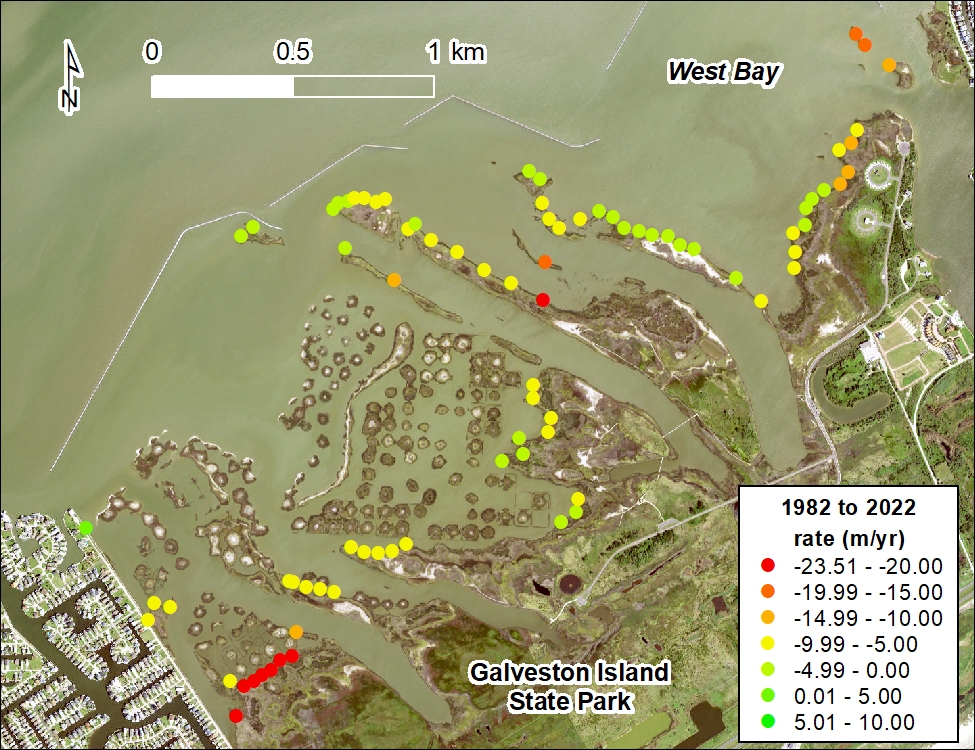
Figure 3. Net rate of short-term movement for the West Bay shoreline in Galveston Island State Park calculated from shoreline positions from 1982 and 2022.
Volumetrics
Volumes and their relationship to elevation help identify areas where sediment has accumulated, as well as areas where little sediment is stored near the shoreline. Peak elevations along the foredunes help identify areas susceptible to breaching and overwash during tropical cyclone passage. The Bureau calculated volumetrics data from the 2019 lidar data which is presented as peak elevations along the Texas Gulf shoreline and as volumes above threshold elevations ranging from 1 to 9 m (3 to 30 ft) relative to the NAVD88 elevation datum (Paine, Caudle, and Andrews, 2021). These volumes can be cast as total volume above a threshold elevation for a given shoreline segment, or as “normalized” alongshore volume above a threshold elevation, calculated by dividing the volume within the shoreline segment by the alongshore length of the segment. Peak elevations and normalized volume above 1 m elevation along the shoreline are presented in the state park online viewer. To view shoreline movement rates and volumetrics data for the entire Texas coast, visit the Bureau’s Texas shoreline change project interactive map (https://coastal.beg.utexas.edu/shorelinechange2019/).
Beach and foredune elevations along most of the upper Texas coast between Sabine Pass and San Luis Pass are among the lowest on the Texas Gulf shoreline. Average dune elevation is 3.3 m (10.9 ft) on Galveston Island with peak elevations of 3.5 m (11.5 ft) or higher along almost 50% of Galveston Island (Paine, Caudle, and Andrews, 2021). The sites in the state park follow the same trend as the whole island of with average peak elevations of 3.3 m (10.9 ft) but with 58% of sites having peak elevations of 3.5 m (11.5 ft) or higher.
Normalized alongshore volumes above 1 m (3 ft) elevation are also very low on the upper Texas coast. Along the Texas Gulf shoreline, the average volume of sediment above 1 m (3.3 ft) elevation per meter alongshore is about 230 m3/m (70 yd3/ft, Paine, Caudle, and Andrews, 2021). For the entirety of Galveston Island, the average volume of sediment above 1 m (3.3 ft) elevation per meter alongshore is 56.5 m3/m (22.6 yd3/ft, Paine, Caudle, and Andrews, 2021). Along the state park shoreline, the average volume is 73.8 m3/m (29.5 yd3/ft), higher than the along Galveston Island but significantly lower than the Texas coast average.
References
Caudle, T. L., and Paine, J. G., 2024, Historical Shoreline Movement in Galveston, Trinity, East and West Bays on the Upper Texas Gulf Coast: The University of Texas at Austin, Bureau of Economic Geology, Final Report prepared for Texas General Land Office, under contract no. 23-020-016-D610, 94 p.
Himmelstoss, E.A., Henderson, R.E., Kratzmann, M.G., and Farris, A.S., 2021, Digital Shoreline Analysis System (DSAS) version 5.1 user guide: U.S. Geological Survey Open-File Report 2021-1091, 104 p., https://doi.org/10.3133/ofr20211091.
Paine, J. G., Caudle, T., and Andrews, J. R., 2021, Shoreline Movement and Beach and Dune Volumetrics along the Texas Gulf Coast, 1930s to 2019: The University of Texas at Austin, Bureau of Economic Geology, Final Report prepared for Texas General Land Office, under contract no. 16-302-000, 101 p.