Mustang Wetlands
Coastal wetlands enhance water quality, provide flood protection, buffer against erosive storm surges, present unique recreational opportunities and provide high-quality habitats for fish and shellfish production and migratory waterfowl. Coastal wetland and aquatic habitats are essential components of inland and barrier island environments along the Texas coast. These valuable resources are highly productive biologically and chemically, and a variety of flora and fauna depend on part of this ecosystem. Scientific investigations of wetland distribution and abundance are needed to effectively manage the habitats and guide mitigation or restoration projects.
The Bureau has undertaken coast-wide studies of the status and trends of wetlands and aquatic habitats along the Texas portion of the Gulf of Mexico. Based on these studies, the Bureau produced a series of GIS datasets and reports designed to determine the status and historical trends of wetlands and associated aquatic habitats. These datasets are vital tools for coastal scientists, managers, planners, and decision makers. The study of status and trends are based on wetlands interpreted and mapped on recent and historical aerial photographs. The wetlands were mapped based upon the vegetation, hydrology, and geography at the time imagery was acquired. These datasets represent the extent, approximate boundary location, and type of wetland at time of imagery collection, the habitat boundaries and type may change through time.
The most recent Bureau wetland status study for Mustang Island State Park was determined by mapping wetlands on color-infrared (CIR) photographs taken in 2002, 2003, and 2004 (White and others, 2006) with historical wetland distribution based on 1956 black-and-white and 1979 CIR photographs. The U.S. Fish and Wildlife Service (USFWS, 1983, unpublished digital data of wetland maps) mapped historical wetland distribution using methods established through the National Wetlands Inventory Program. The Bureau obtained the 1956 and 1979 wetland map GIS files from USFWS and partly revised them to be more consistent with wetlands interpreted on the 2002-04 photographs (White and others, 2006). Mapping of the wetland and aquatic habitats was done by interpreting and delineating habitats onscreen in GIS at a scale of 1:5,000. This allowed for more detailed mapping. The 2002-04 maps were used to make comparisons with the historical mapping to determine habitat trends (White and others, 2006). The 1956, 1979, and 2002-04 wetland status maps are included in the data viewer. For this project, the most recent USFWS National Wetland Inventory data are also included (https://www.fws.gov/program/national-wetlands-inventory/data-download).
The wetland mapping by the USFWS and Bureau follows the classification determined by Cowardin and others (1979) in Wetlands and Deepwater Habitats of the United States. Wetlands are classified by system (marine, estuarine, riverine, palustrine, or lacustrine), subsystem (reflective of hydrologic conditions), and class (descriptive of vegetation and substrate). The systems represented in Mustang Island State Park include estuarine, palustrine, and marine (Table 1). The 1979 and 2002-04 maps were also classified by subclass (subdivisions of vegetated classes only) and water regime (Table 2). The 1956 wetlands were mapped only down to class.
| NWI code (water regime) | NWI description | Common description |
| E1AB1 | Estuarine, subtidal aquatic bed, algal | Estuarine seagrass |
| E1AB3 | Estuarine, subtidal aquatic bed, rooted vascular | Estuarine seagrass |
| E1UB | Estuarine, subtidal unconsolidated bottom | Estuarine bay (Corpus Christi Bay) |
| E2AB1 (N, P) | Estuarine, intertidal aquatic bed, algal | Algal mat |
| E2EM1 (N, P) | Estuarine, intertidal emergent, persistent | Estuarine bay marshes, salt and brackish water |
| E2SS3 | Estuarine, intertidal, shrub-scrub, broad-leaved evergreen | Estuarine scrub-shrub wetland |
| E2US (M, N, P) | Estuarine, intertidal unconsolidated shore | Estuarine bay, tidal flats, beaches |
| M1UB | Marine, subtidal, unconsolidated bottom | Gulf of Mexico |
| M2US (N, P) | Marine, intertidal, unconsolidated shore | Gulf beach |
| PEM1 (A, C) | Palustrine, emergent persistent | Freshwater marshes, meadows, depressions, or drainage areas |
| PSS1 (A) | Palustrine, scrub-shrub, broad-leaved deciduous | Freshwater scrub-shrub wetland |
| PUB | Palustrine, unconsolidated bottom | Pond |
| PUS | Palustrine, unconsolidated shore | Freshwater flats |
| U | Upland | Upland |
| Nontidal | |
| A | Temporarily flooded: Surface water present for brief periods during growing season, but water table usually lies well below soil surface. Plants that grow both in uplands and wetlands are characteristic of this water regime. |
| C | Seasonally flooded: Surface water is present for extended periods, especially early in the growing season, but is absent by the end in most years. When surface water is absent, the water table is often near the land surface. |
| Tidal | |
| M | Irregularly exposed: Land surface is exposed by tides less often than daily. |
| N | Regularly flooded: Tidal water alternately floods and exposes the land surface at least once daily. |
| P | Irregularly flooded: Tidal water floods the land surface less often than daily. |
A wetland trend analysis was completed by examining the distribution of wetland habitats as mapped in 1956, 1979, and 2002-04. Wetland classes were emphasized in the trend analysis over water regime and special modifiers, in part because wetland habitats were only mapped to the class level on the 1956 photography. Also, water regime classification can be influenced by local or shore-term events such as precipitation (for example, the 1950s Texas drought) and tidal cycles.
The estuarine system consists of many types of wetland habitats. Estuarine subtidal unconsolidated bottom (E1UB 2002-04), or open water (E1OW 1956 and 1979), occurs in the bays and adjacent salt and brackish marshes. Unconsolidated shore (E2US 2002-04) includes tidal flats (E2FL 1956 and 1979) and algal mats (E2AB 2002-04). The emergent areas around estuarine waters consist of low and high marshes (E2EM) that contain a variety of salt-tolerant and brackish-tolerant plants or scrub-shrub (E2SS 2022-04) that contain mangroves. The mapping of the boundaries between estuarine and palustrine systems is subjective based upon proximity to estuarine water bodies and vegetation types. A pond or emergent wetland is typically placed in the palustrine system if it is separated from the estuarine system by an upland break.
Mapped palustrine areas included the following classes: unconsolidated bottom or open water ponds (PUB 2002-04, POW 1956 and 1979), emergent wetlands (PEM), scrub-shrub (PSS 2002-04), and flats (PUS 2002-04). The palustrine emergent wetlands are fresh or inland marshes not inundated by tidal waters. The marine system consists of the Gulf of Mexico open water (M1UB 2002-04, M1OW 1956 and 1979) and Gulf beaches (M2US 2002-04, M2BB 1956 and 1979).
In 2002-04, wetland and aquatic habitats covered 1,011 ha (2,498 ac) within Mustang Island State Park (Fig. 1) and 1,281 ha (3166 ac) were classified as uplands. A hectare (ha) is 10,000 square meters (100 m by 100 m) and equal to 2.47 acres (ac). The estuarine system is the largest of the wetland systems mapped covering 910 ha (2,249 ac), 90% of all wetland and aquatic habitats (Fig. 12). Approximately 454 ha (1,123 ac) of estuarine tidal flats and algal flats (E2US and E2AB) were mapped in the study area. These two habitats make up 45% of the wetlands and aquatic habitats. The estuarine intertidal emergent wetland habitat (E2EM) consists of 312 ha (772 ac) of salt or brackish marshes. This habitat makes up 31% of the study area, excluding the upland unit. Aquatic beds (E1AB) comprise 138 ha (341 ac), or 14% of habitats. The total mapped area of Gulf beaches in Mustang Island State Park was 63 ha (157 ac), 6% of mapped wetland and aquatic habitats in 2002-04, palustrine marsh was 35 ha (87 ac), 3.5% of habitats; and palustrine open water (OW, freshwater ponds) and surrounding flats were approximately 2 ha (5.5 ac), less than 1% of mapped wetland and aquatic habitats in 2002-04.
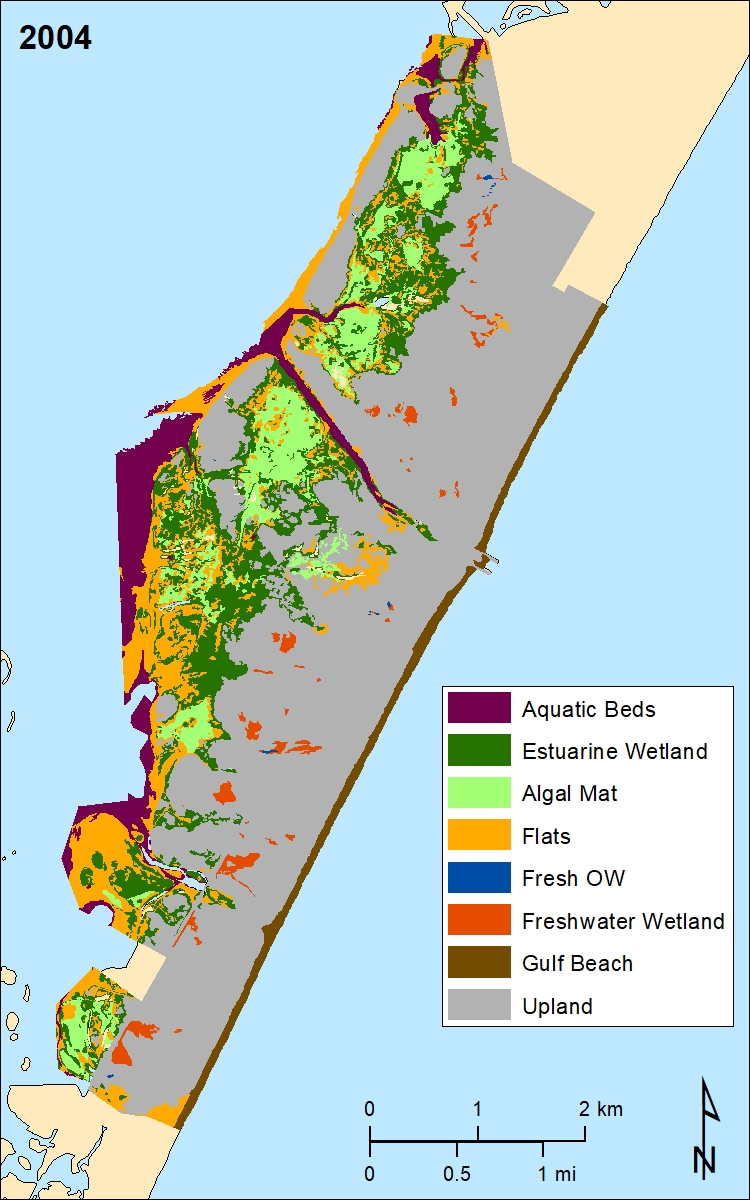
Figure 1. Areal distribution of habitats in Mustang Island State Park in 2002-04. Modified from White and others, 2006.
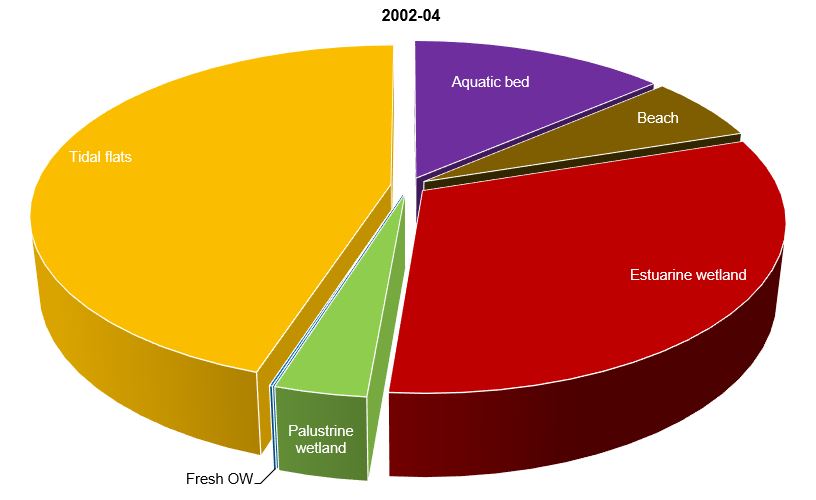
Figure 2. Areal extent of mapped wetland and aquatic habitats in 2002-04. Modified from White and others, 2006.
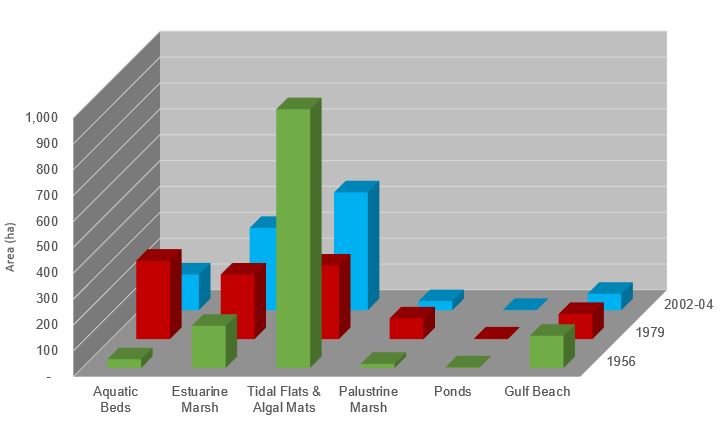
Broad wetland classes were emphasized over water regimes in analyzing historical trends due to the limitations of the 1956 mapping. The total area of estuarine marshes has increased between the mapping periods, from 163 ha (403 ac) in 1956, to 250 ha (617 ac) in 1979, to 318 ha (785 ac) in 2002-04 (Table 3, Figs. 3 and 4). The total area of palustrine marsh increased from 1956 (16 ha, 40 ac) to 1979 (80 ha, 197 ac), but decreased by almost 60% by 2002-04 (35 ha, 87 ac). In Mustang Island State Park, tidal flats and algal mats have decreased significantly over time. In 1956, these habitats covered 1,033 ha (2,554 ac), decreased to 284 ha (702 ac) in 1979, then increased to 455 ha (1,125 ac) in 2002-04 (Table 3, Figs. 3 and 4).
| Habitat | 1956 | 1979 | 2002-04 | |||
| ha | acres | ha | acres | ha | acres | |
| Aquatic Beds | 34 | 83 | 303 | 749 | 138 | 341 |
| Estuarine Marsh | 163 | 403 | 250 | 617 | 318 | 785 |
| Tidal Flats & Algal Mats | 1,033 | 2,554 | 284 | 702 | 455 | 1,125 |
| Palustrine Marsh | 16 | 40 | 80 | 197 | 35 | 87 |
| Ponds | 3 | 6 | 3 | 6 | 1 | 3 |
| Gulf Beach | 124 | 308 | 97 | 240 | 63 | 157 |
| Uplands | 873 | 2,158 | 1,304 | 3,222 | 1,281 | 3,166 |
Analysis of trends in wetlands and aquatic habitats in the Mustang Island State Park area show that there was a net increase in marshes from 1956 through 2002-04. Emergent wetlands (both estuarine and palustrine) increased from 179 to 353 ha (443 to 872 ac), a gain of almost double the area of emergent marshes (174 ha, 430 ac, Table 3, Fig. 3). The majority of the emergent marsh gain occurred between 1956 to 1979 at a rate of 6.5 ha/yr gain (16 ac/yr). The trend of increased marsh continued between 1979 and 2002-04, but at a much-reduced rate (< 1ha/yr). A recurring trend in wetland habitat studies along the entire Texas coast is the significant loss of tidal flats (White and others 2006). Between 1956 and 1979, tidal flat area decreased at a rate of 32.5 ha/yr (80 ac/yr, Table 3, Figs. 3 and 4). A probable cause for the loss of tidal flats since the 1950s is relative sea level rise (White and others, 2006). Much of the area mapped as wind tidal flat in 1956 converted to aquatic beds (seagrass), open water, or marsh, as low-lying flats were submerged and slightly higher flats were more frequently flooded (Fig. 4, White and others, 2006).
Areal distribution of habitats in Mustang Island State Park in 1956, 1979, and 2002-04. Modified from White and others, 2006.
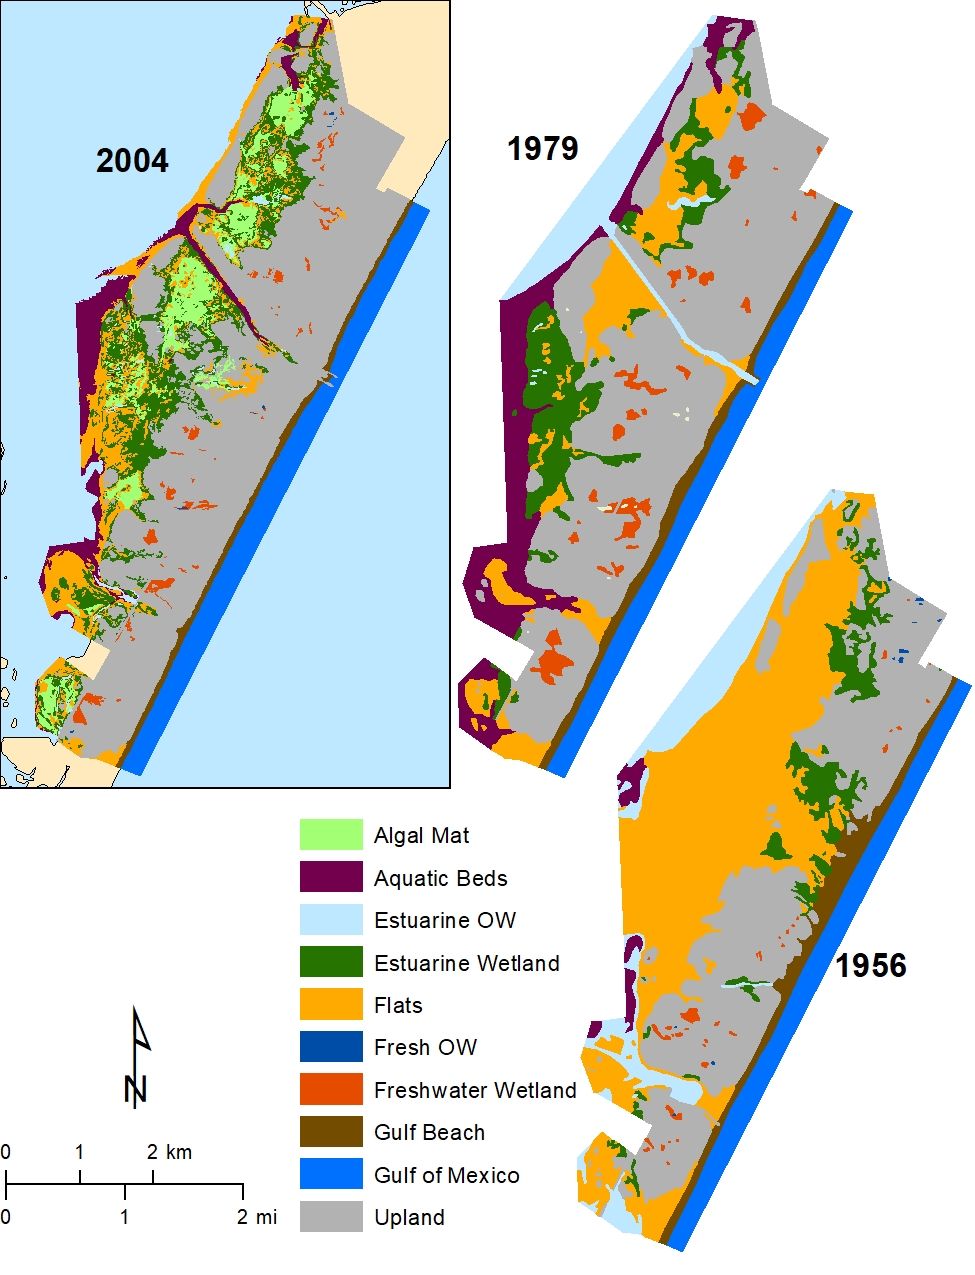
Figure 4. Maps showing distribution of major wetland and aquatic habitats in 2004, 1979, and 1956 in Mustang Island State Park. Modified from White and others, 2006.
Analysis of trends in wetlands and aquatic habitats in the Mustang Island State Park area show that there was a net increase in marshes from 1956 through 2002-04. Emergent wetlands (both estuarine and palustrine) increased from 179 to 353 ha (443 to 872 ac), a gain of almost double the area of emergent marshes (174 ha, 430 ac, Table 3, Fig. 3). The majority of the emergent marsh gain occurred between 1956 to 1979 at a rate of 6.5 ha/yr gain (16 ac/yr). The trend of increased marsh continued between 1979 and 2002-04, but at a much-reduced rate (< 1ha/yr). A recurring trend in wetland habitat studies along the entire Texas coast is the significant loss of tidal flats (White and others 2006). Between 1956 and 1979, tidal flat area decreased at a rate of 32.5 ha/yr (80 ac/yr, Table 3, Figs. 3 and 4). A probable cause for the loss of tidal flats since the 1950s is relative sea level rise (White and others, 2006). Much of the area mapped as wind tidal flat in 1956 converted to aquatic beds (seagrass), open water, or marsh, as low-lying flats were submerged and slightly higher flats were more frequently flooded (Fig. 4, White and others, 2006).
References
Cowardin, L.M., Carter, V., Golet, F. C., and LaRoe, E. T., 1979, Classification of Wetlands and Deepwater Habitats of the United States: U.S. Department of the Interior, Fish and Wildlife Service, Washington, DC. FWS/OBS-79/31.
USFWS, 2023, USFWS National Wetlands Inventory: U.S. Department of the Interior, Fish and Wildlife Service, Washington, DC, downloaded from https://www.fws.gov/program/national-wetlands-inventory/data-download.
White, W. A., Tremblay, T. A., Waldinger, R. L., and Calnan, T. R., 2006, Status and Trends of Wetland and Aquatic Habitats on Texas Barrier Islands, Coastal Bend: The University of Texas at Austin, Bureau of Economic Geology, Final Report prepared for Texas General Land Office, under contract no. 05-041, 65 p.