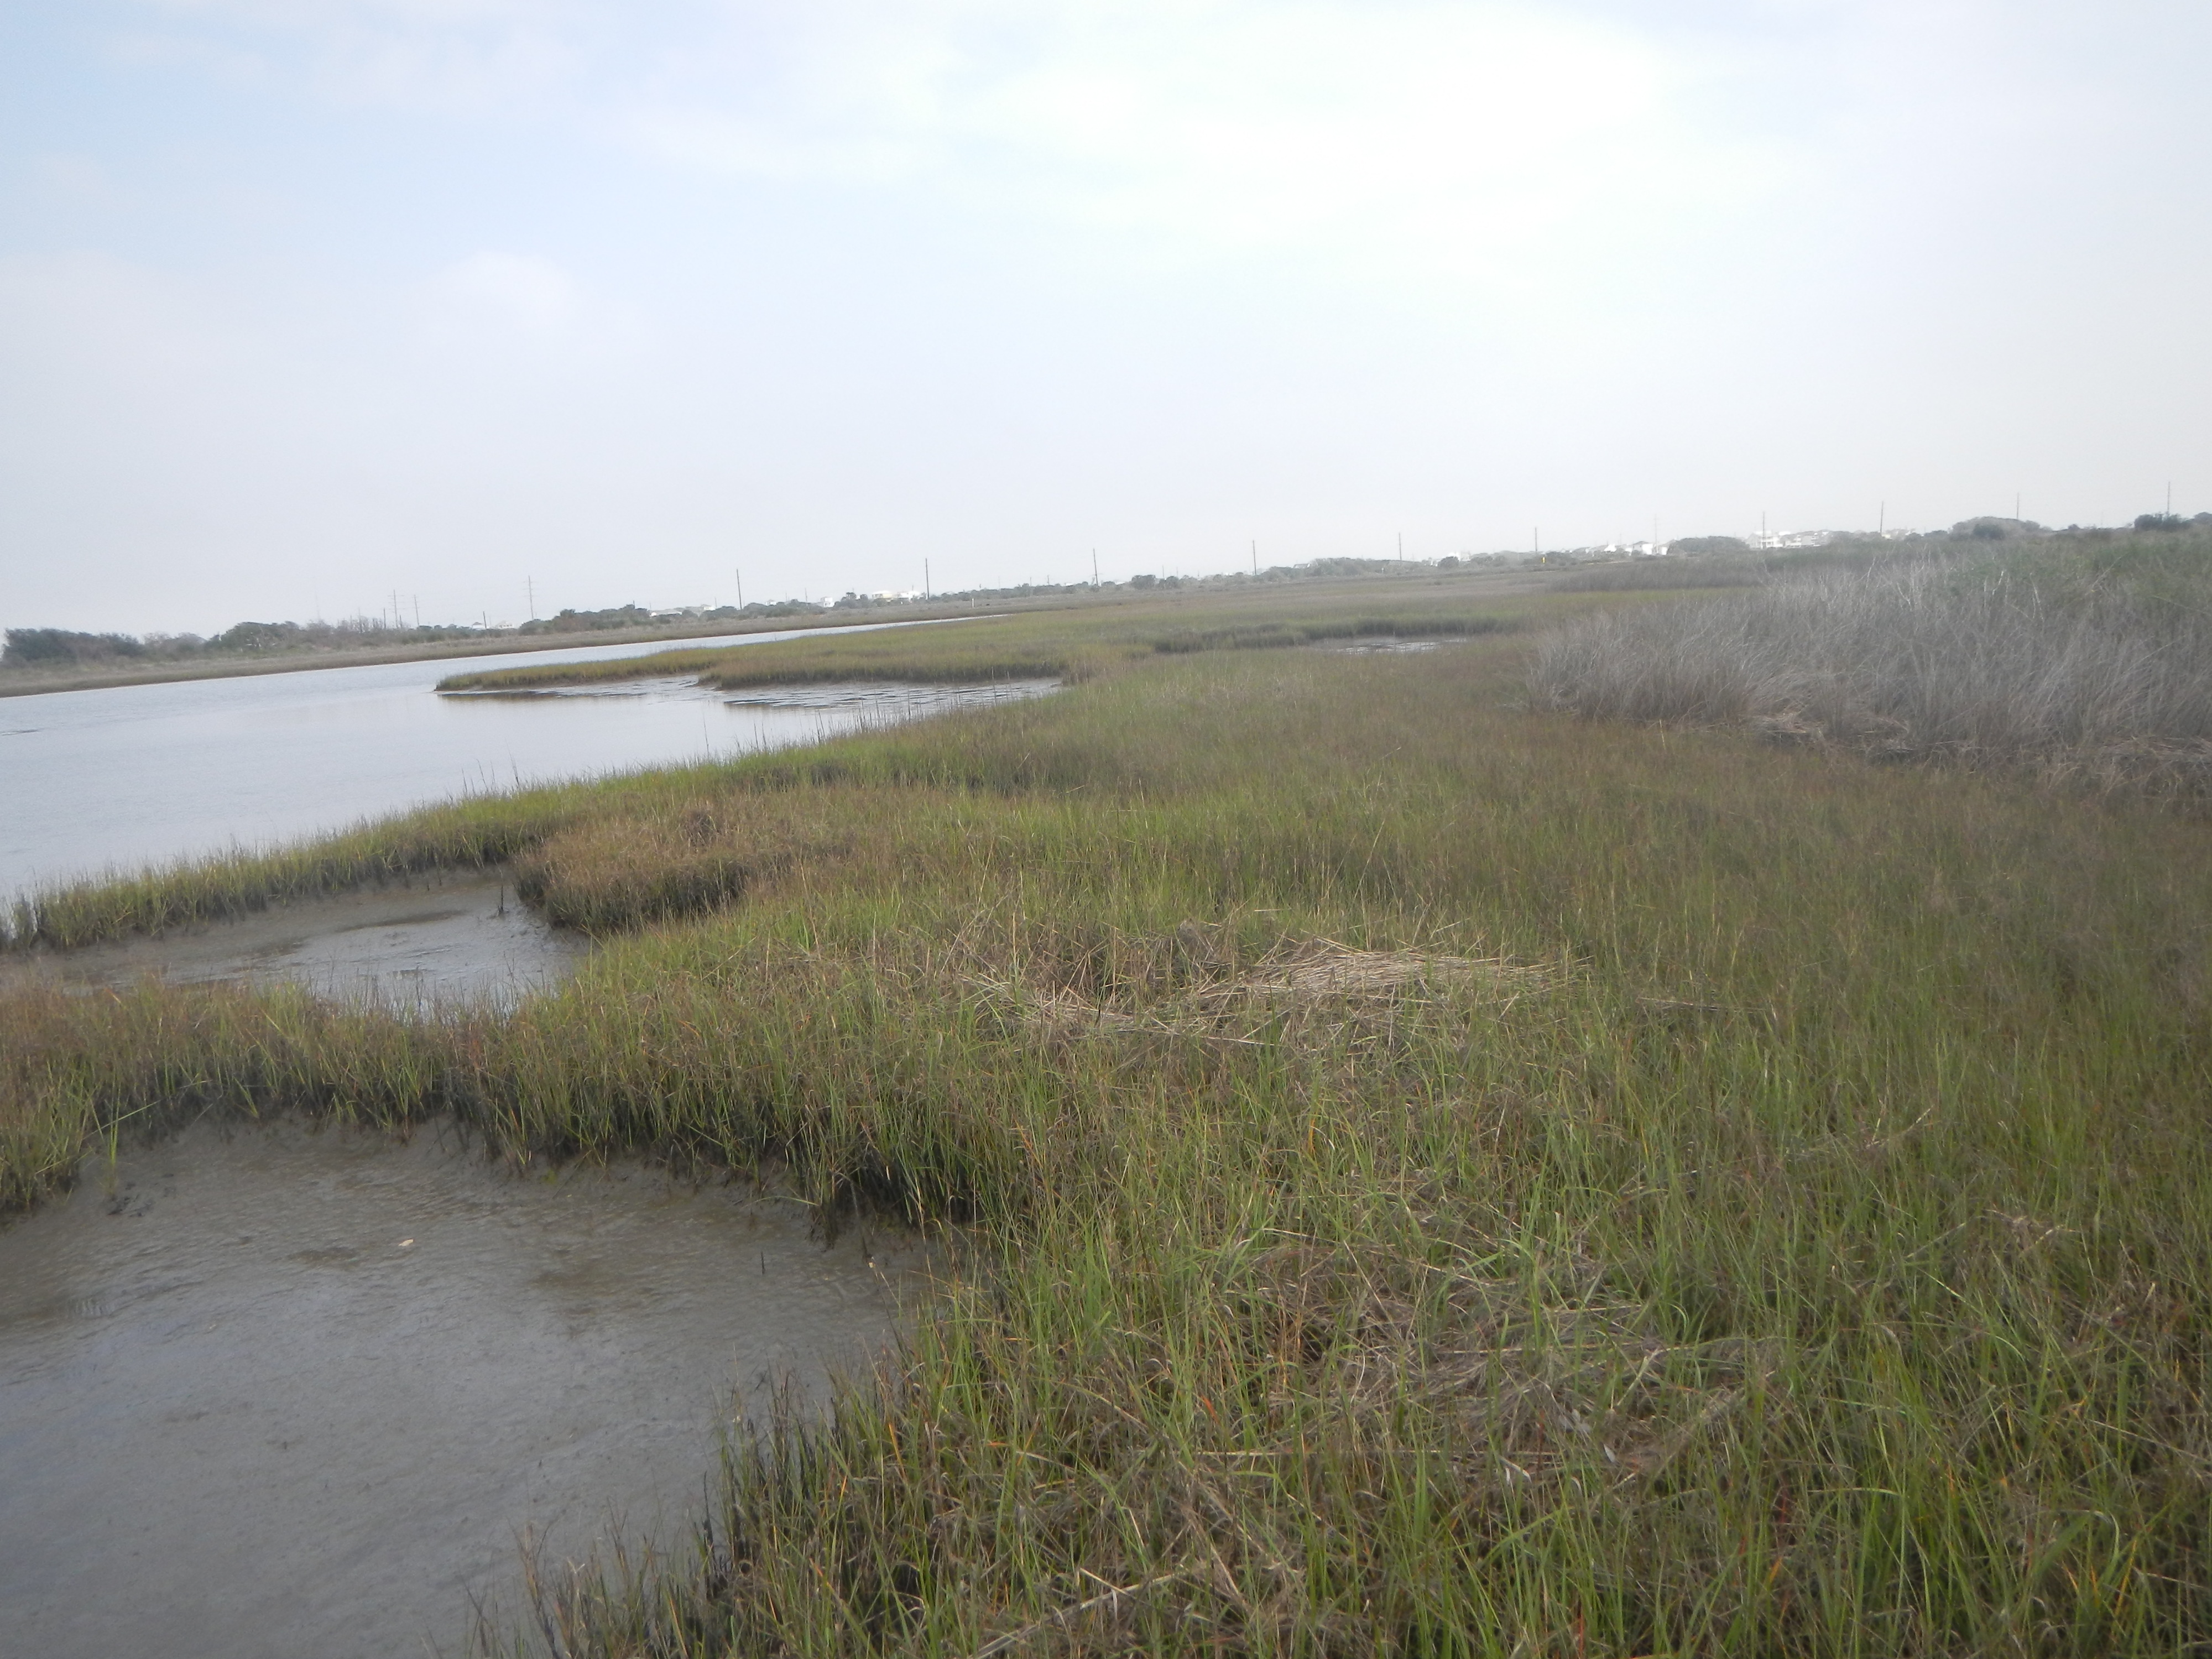
Figure 3A. Example of salt-water marsh, E2EM, on the bay margin in Galveston Island State Park.

Coastal wetlands enhance water quality, provide flood protection, buffer against erosive storm surges, present unique recreational opportunities and provide high-quality habitats for fish and shellfish production and migratory waterfowl. Coastal wetland and aquatic habitats are essential components of inland and barrier island environments along the Texas coast. These valuable resources are highly productive biologically and chemically, and a variety of flora and fauna depend on part of this ecosystem. Scientific investigations of wetland distribution and abundance are needed to effectively manage the habitats and guide mitigation or restoration projects.
The Bureau has undertaken coast-wide studies of the status and trends of wetlands and aquatic habitats along the Texas portion of the Gulf of Mexico. Based on these studies, the Bureau produced a series of GIS datasets and reports designed to determine the status and historical trends of wetlands and associated aquatic habitats. These datasets are vital tools for coastal scientists, managers, planners, and decision makers. The study of status and trends are based on wetlands interpreted and mapped on recent and historical aerial photographs. The wetlands were mapped based upon the vegetation, hydrology, and geography at the time imagery was acquired. These datasets represent the extent, approximate boundary location, and type of wetland at time of imagery collection, the habitat boundaries and type may change through time.
The most recent Bureau wetland status study for Galveston Island State Park was determined by mapping wetlands on color-infrared (CIR) photographs taken in 2002 (White and others, 2004) with historical wetland distribution based on 1956 black-and-white and 1979 CIR photographs. For this project, wetland boundaries were updated using 2022 NAIP imagery and ground investigations. The U.S. Fish and Wildlife Service (USFWS, 1983, unpublished digital data of wetland maps) mapped historical wetland distribution using methods established through the National Wetlands Inventory Program. The Bureau obtained the 1956 and 1979 wetland map GIS files from USFWS and partly revised them to be more consistent with wetlands interpreted on the 2004 photographs (White and others, 2004). Mapping of the wetland and aquatic habitats was done by interpreting and delineating habitats onscreen in GIS at a scale of 1:5,000. This allowed for more detailed mapping. The 2002 maps were used to make comparisons with the historical mapping to determine habitat trends (White and others, 2004).
The wetland mapping by the USFWS and BEG follows the classification determined by Cowardin and others (1979) in Wetlands and Deepwater Habitats of the United States. Wetlands are classified by system (marine, estuarine, riverine, palustrine, or lacustrine), subsystem (reflective of hydrologic conditions), and class (descriptive of vegetation and substrate). The systems represented in Galveston Island State Park include estuarine, palustrine, and marine (Table 1). The 1979 and 2002 maps were also classified by subclass (subdivisions of vegetated classes only), water regime (Table 2), and special modifiers (s=spoil, x=excavated). The 1956 wetlands were mapped only down to class.
| NWI code (water regime) | NWI description | Common description |
| E1AB1 | Estuarine, subtidal aquatic bed, algal | Estuarine seagrass |
| E1AB3 | Estuarine, subtidal aquatic bed, rooted vascular | Estuarine seagrass |
| E1AB5 | Estuarine, subtidal aquatic bed, unknown submergent | Estuarine vegetation |
| E1UB | Estuarine, subtidal unconsolidated bottom | Estuarine bay (West Bay) |
| E2AB1 (N, P) | Estuarine, intertidal aquatic bed, algal | Algal mat |
| E2EM1 (N, P, s) | Estuarine, intertidal emergent, persistent | Estuarine bay marshes, salt and brackish water |
| E2US (M, N, P, s) | Estuarine, intertidal unconsolidated shore | Estuarine bay, tidal flats, beaches |
| M1UB | Marine, subtidal, unconsolidated bottom | Gulf of Mexico |
| M2US (N, P) | Marine, intertidal, unconsolidated shore | Gulf beach |
| PEM1 (A, C, F) | Palustrine, emergent persistent | Freshwater marshes, meadows, depressions, or drainage areas |
| PSS | Palustrine, scrub-shrub, broad-leaved deciduous | Freshwater scrub-shrub wetland |
| PUB (Hx) | Palustrine, unconsolidated bottom | Pond |
| U | Upland | Upland |
| Nontidal | |
| A | Temporarily flooded: Surface water present for brief periods during growing season, but water table usually lies well below soil surface. Plants that grow both in uplands and wetlands are characteristic of this water regime. |
| C | Seasonally flooded: Surface water is present for extended periods, especially early in the growing season, but is absent by the end in most years. When surface water is absent, the water table is often near the land surface. |
| F | Semipermanently flooded: Surface water persists throughout the growing season in most years. When surface water is absent, the water table is usually at or very near the land surface. |
| H | Permanently flooded: Water covers land surface throughout the year in all years. |
| Tidal | |
| M | Irregularly exposed: Land surface is exposed by tides less often than daily. |
| N | Regularly flooded: Tidal water alternately floods and exposes the land surface at least once daily. |
| P | Irregularly flooded: Tidal water floods the land surface less often than daily. |
A wetland trend analysis was completed by examining the distribution of wetland habitats as mapped in 1956, 1979, 2002, and 2022. Wetland classes were emphasized in the trend analysis over water regime and special modifiers, in part because wetland habitats were only mapped to the class level on the 1956 photography. Also, water regime classification can be influenced by local or shore-term events such as precipitation (for example, the 1950s Texas drought) and tidal cycles.
The estuarine system consists of many types of wetland habitats. Estuarine subtidal unconsolidated bottom (E1UB 2002 and 2022), or open water (E1OW 1956 and 1979), occurs in the bays and adjacent salt and brackish marshes. Unconsolidated shore (E2US 2002 and 2022) includes tidal flats (E2FL 1956 and 1979) and algal mats (E2AB 2022). The emergent areas around estuarine waters consist of low and high marshes (E2EM) that contain a variety of salt-tolerant and brackish-tolerant plants. The mapping of the boundaries between estuarine and palustrine systems is subjective based upon proximity to estuarine water bodies and vegetation types. A pond or emergent wetland is typically placed in the palustrine system if it is separated from the estuarine system by an upland break.
Mapped palustrine areas included the following classes: unconsolidated bottom or open water ponds (PUB 2002 and 2022, POW 1956 and 1979), emergent wetlands (PEM), and scrub-shrub (PSS 2002 and 2022). The palustrine emergent wetlands are fresh or inland marshes not inundated by tidal waters. The marine system consists of the Gulf of Mexico open water (M1UB 2002 and 2022, M1OW 1956 and 1979) and Gulf beaches (M2US 2002 and 2022, M2BB 1956 and 1979).
In 2022, wetland and aquatic habitats covered 162 ha (400 ac) within Galveston Island State Park (Fig. 1) and 318 ha (786 ac) were classified as uplands. A hectare (ha) is 10,000 square meters (100 m by 100 m) and equal to 2.47 acres (ac). The estuarine system is the largest of the wetland systems mapped covering 135 ha (333 ac), 83% of all wetland and aquatic habitats (Fig. 2). The estuarine intertidal emergent wetland habitat (E2EM, Fig. 3A) consists of 121 ha (299 ac) of salt or brackish marshes. This habitat makes up 75% of the study area, excluding the upland unit. Approximately 10 ha (25 ac) of estuarine tidal flats (Fig. 3B) and algal flats (E2US and E2AB) was mapped in the study area and 4 ha (9 ac) of aquatic beds (E1AB). The total mapped area of Gulf beaches (Fig. 4A) in Galveston Island State Park was 12 ha (30 ac), 7% of mapped wetland and aquatic habitats in 2022, palustrine marsh (Fig. 4B) was 6 ha (15 ac), 4% of habitats; and palustrine open water (fresh open water or ponds) was approximately 9 ha (21 ac), around 6% of mapped wetland and aquatic habitats in 2022.
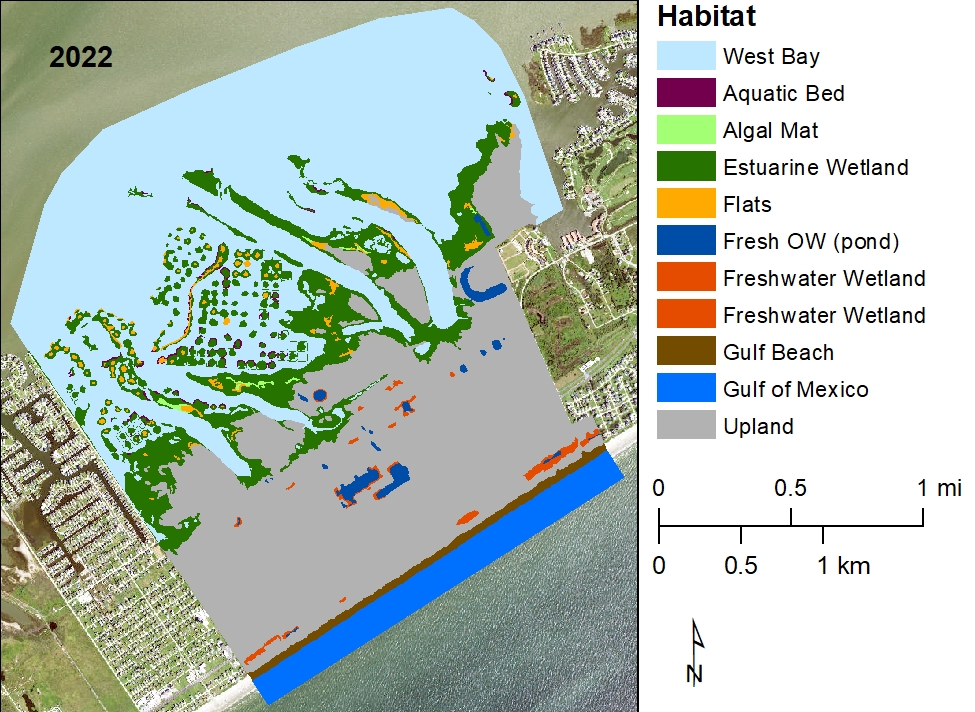
Figure 1. Areal distribution of habitats in Galveston Island State Park in 2022.
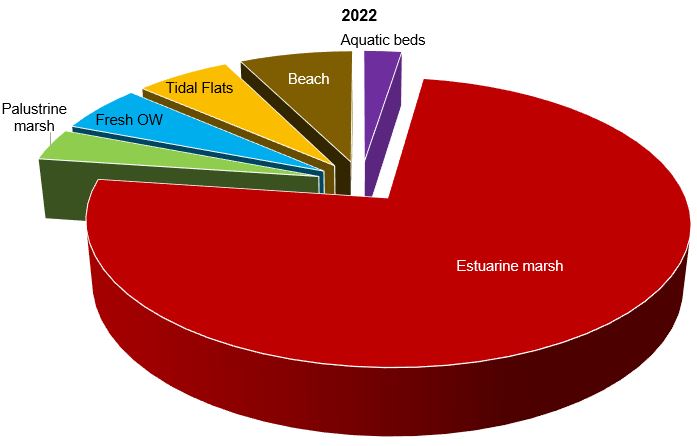
Figure 2. Areal extent of mapped wetland and aquatic habitats in 2022.
Figure 3A. Example of salt-water marsh, E2EM, on the bay margin in Galveston Island State Park.
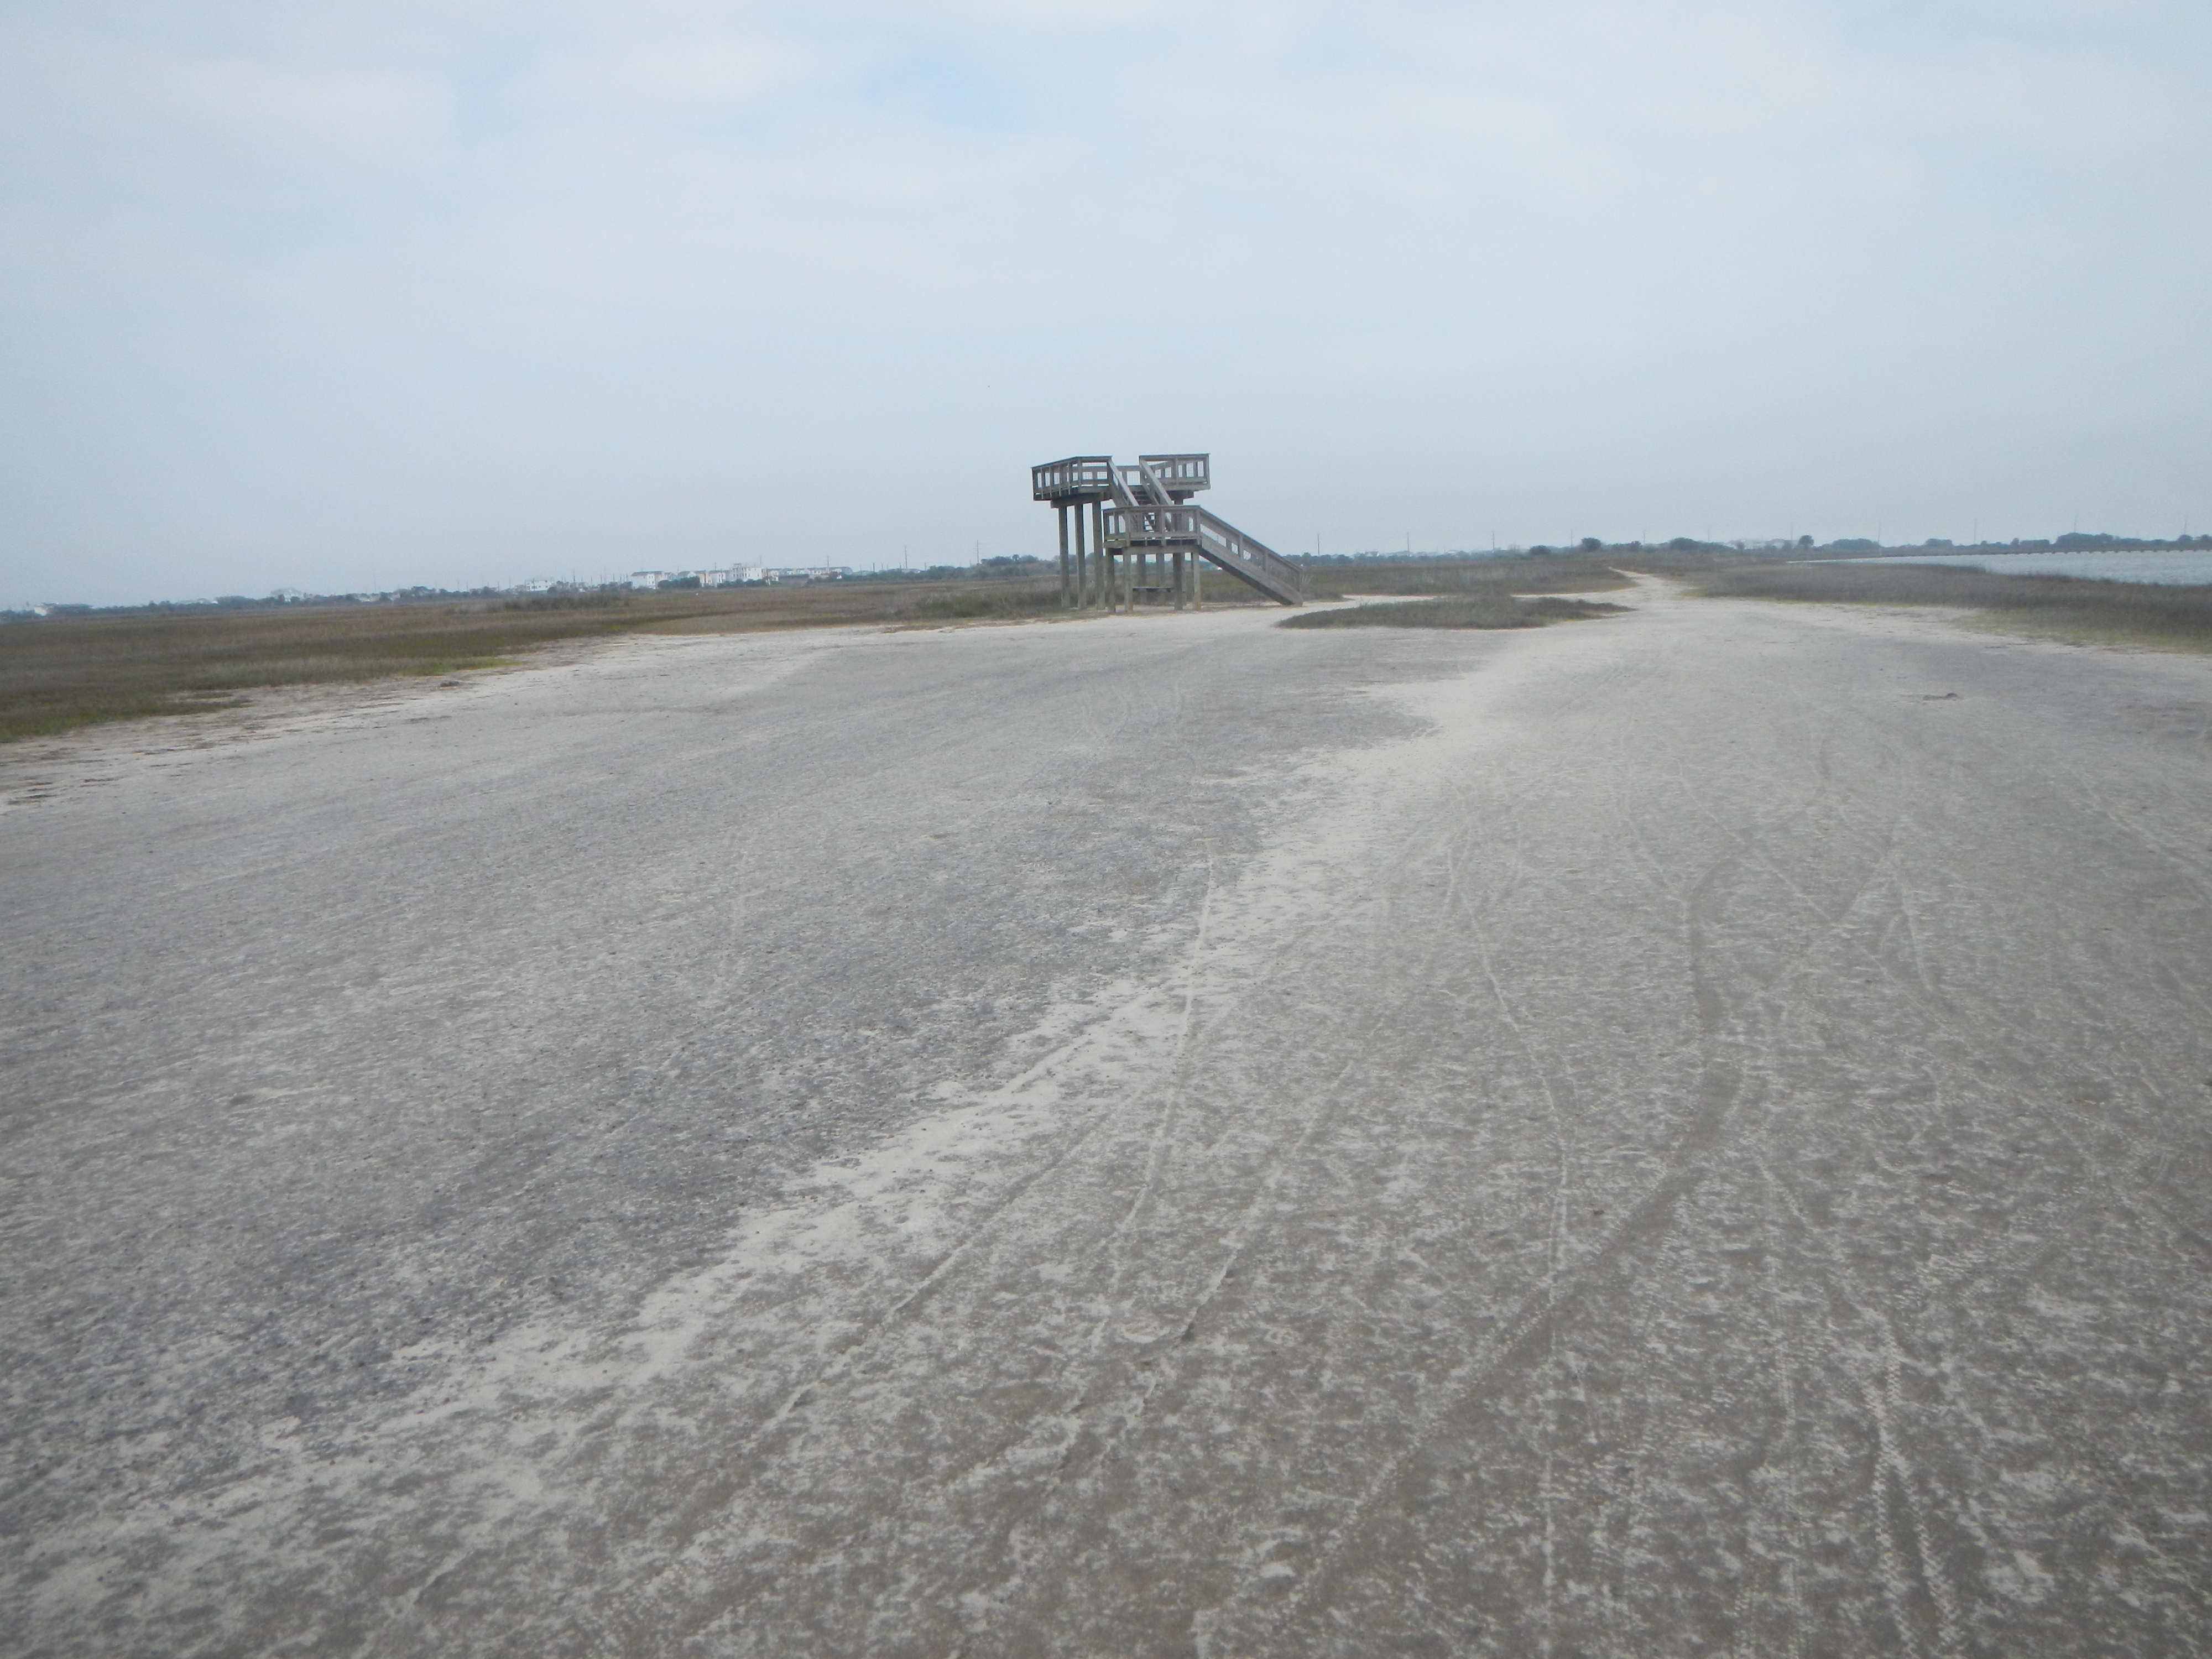
Figure 3B. Example of tidal flats, E2US, on the bay margin in Galveston Island State Park.
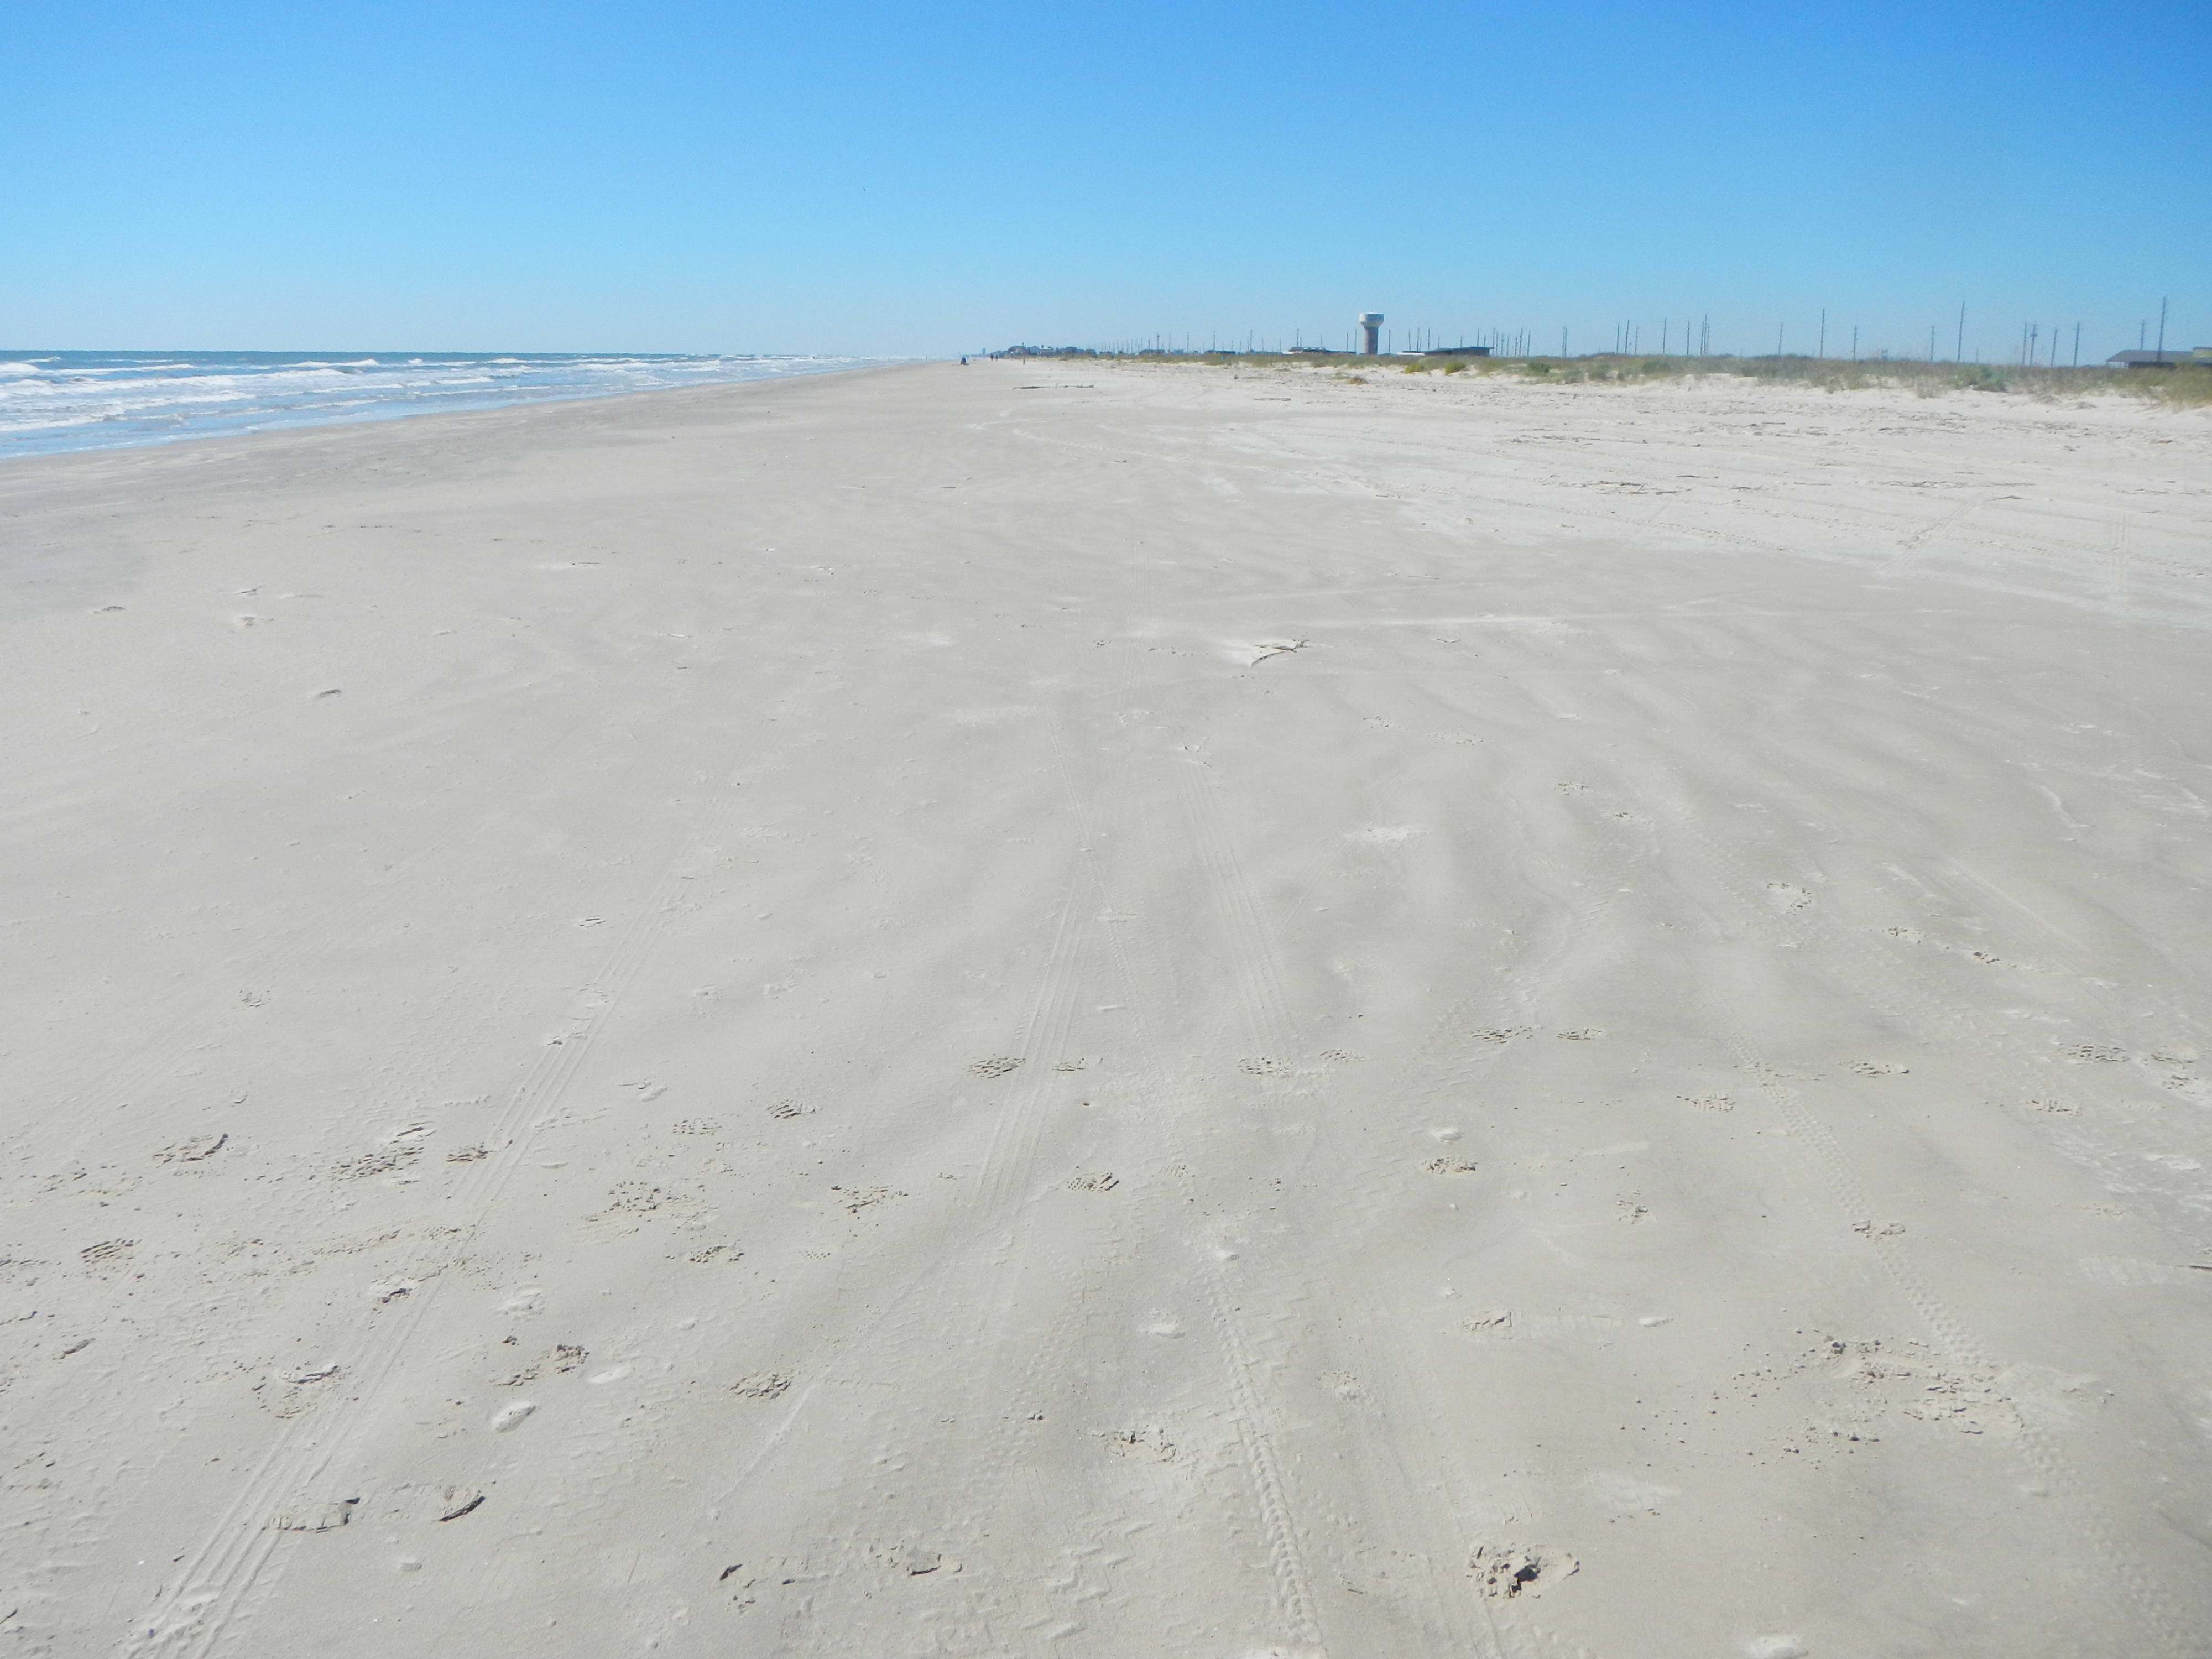
Figure 4. Example of Gulf beach, M2US, in Galveston Island State Park.
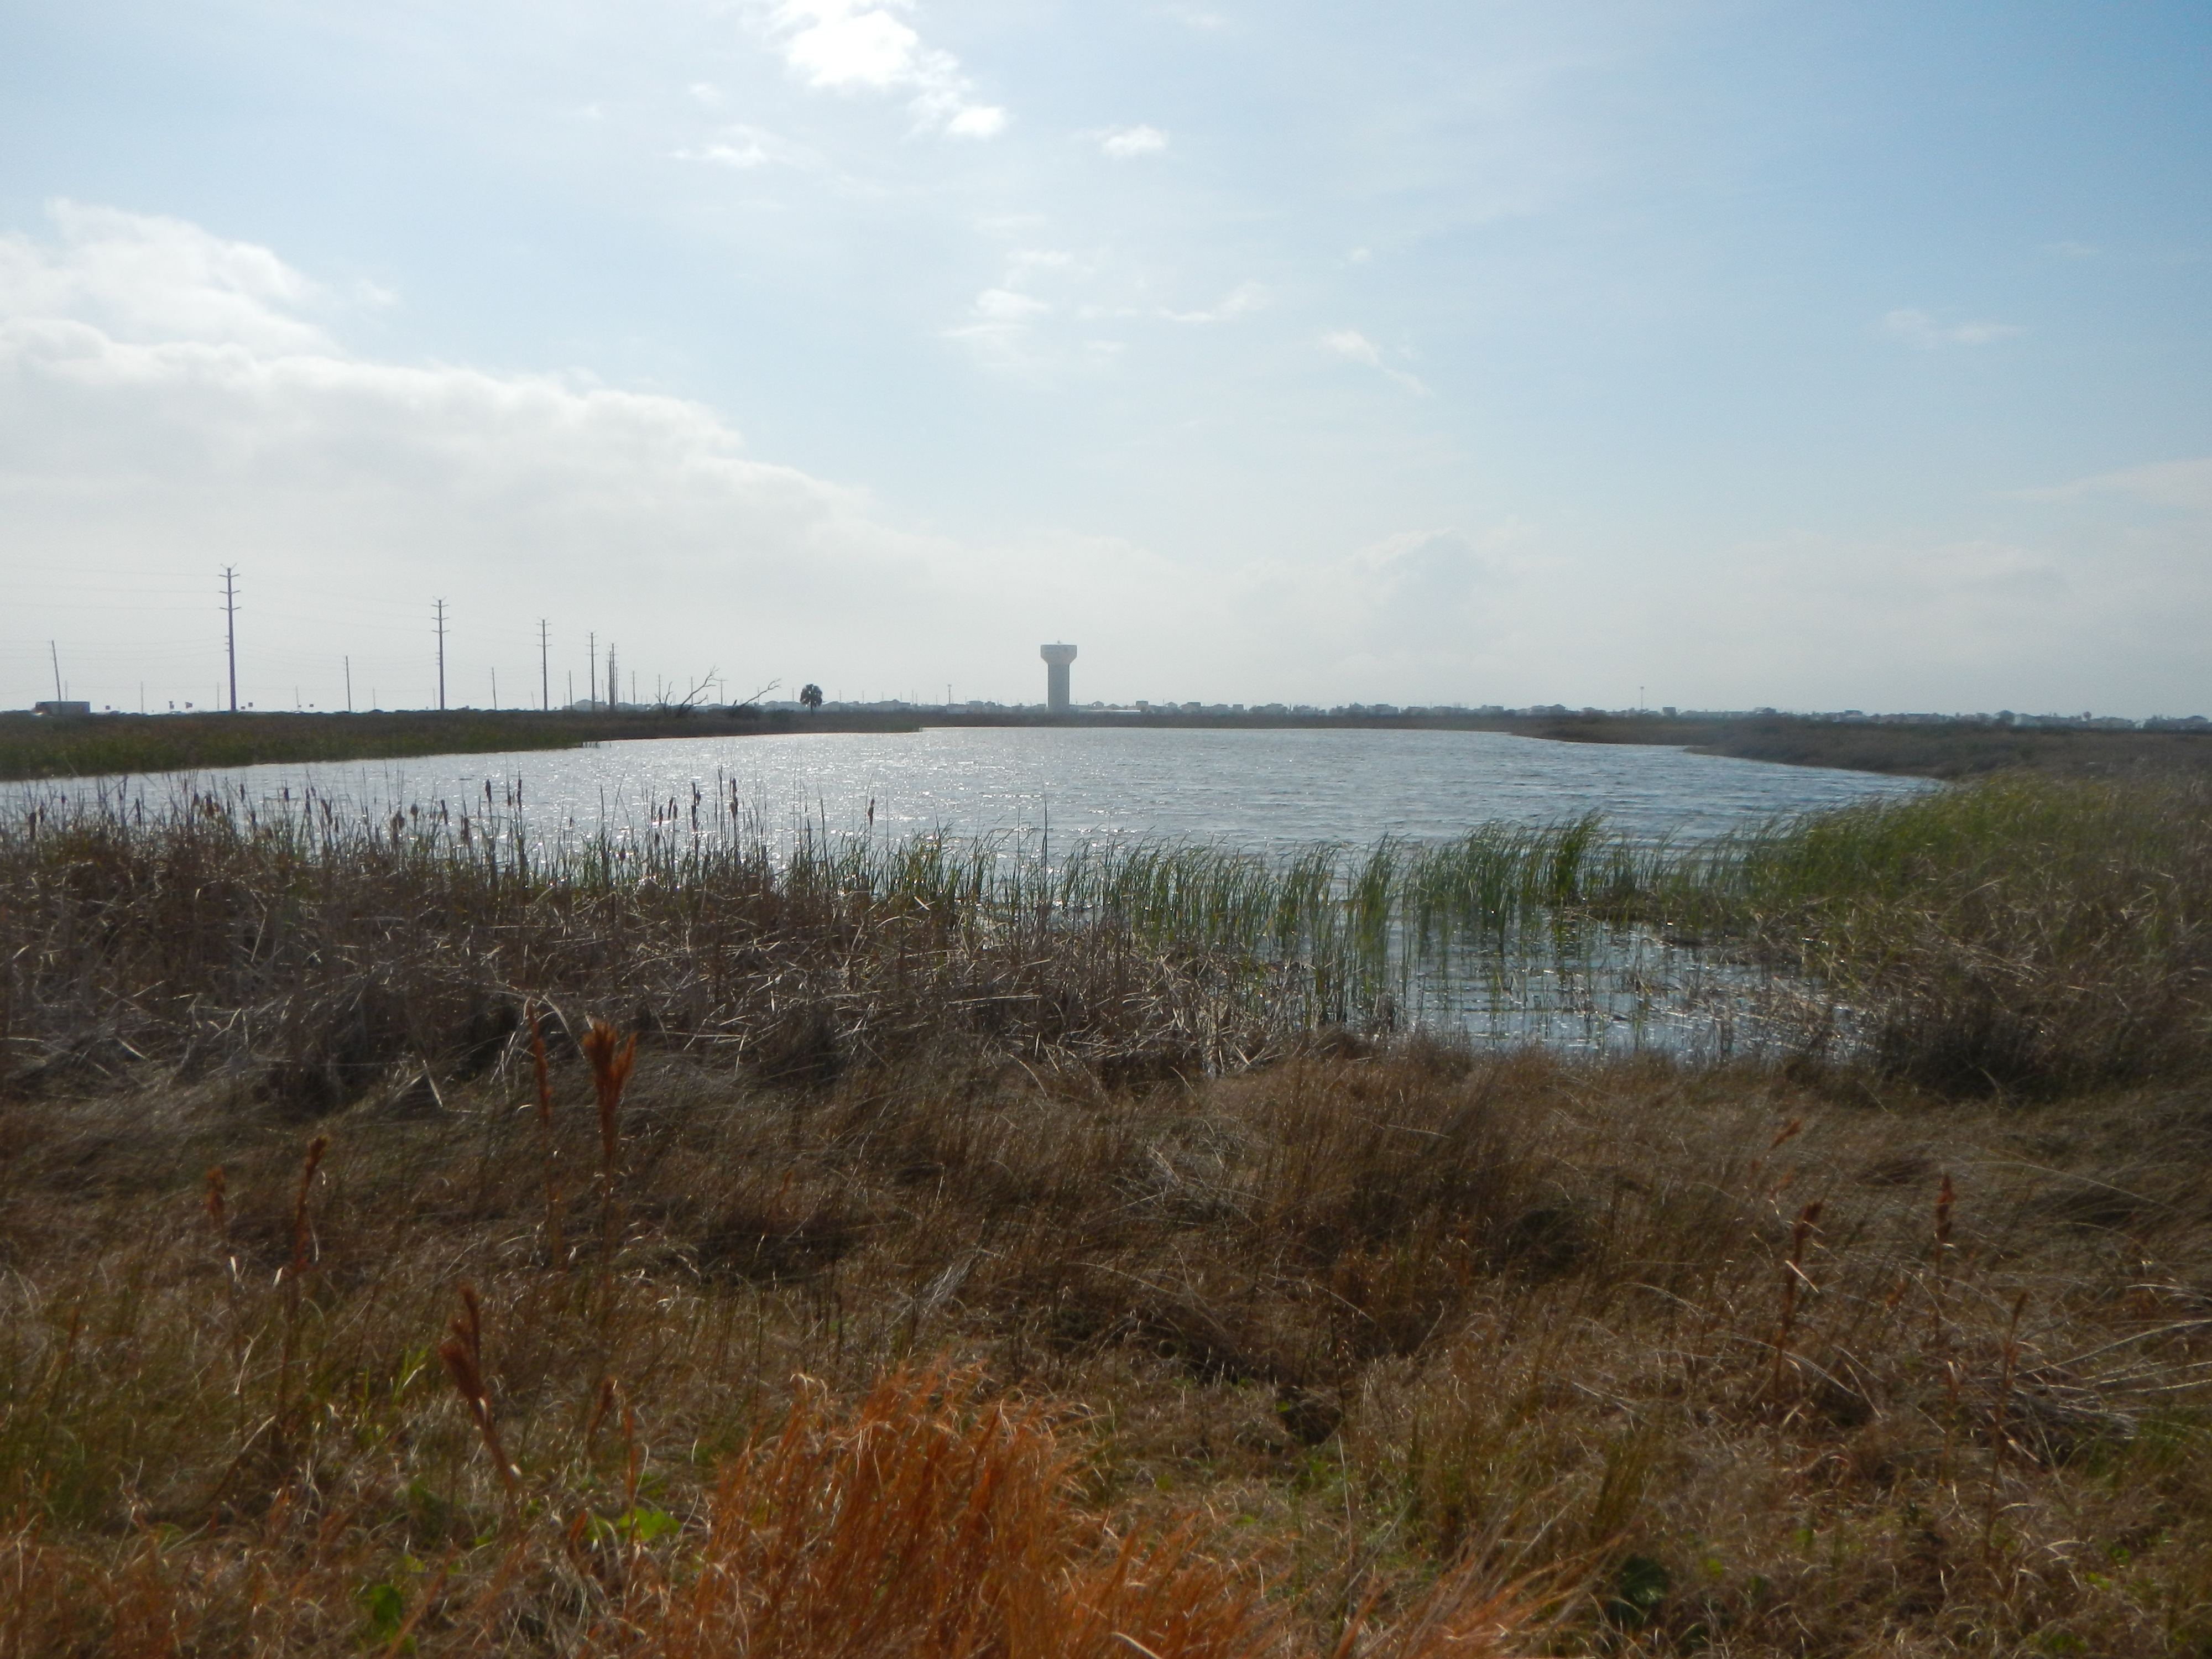
Figure 4. Example of freshwater marsh and pond, PEM and PUB, in Galveston Island State Park.
Broad wetland classes were emphasized over water regimes in analyzing historical trends due to the limitations of the 1956 mapping. The total area of estuarine marshes decreased significantly between 1956 and 2022, from 274 ha (677 ac) in 1956 to 121 ha (299 ac) in 2022 (Table 3, Figs. 5 and 6). The total area of palustrine marsh was stable (16 ha, 39 ac) in 1956 and 1979, but decreased by almost 70% by 2002 (5 ha, 12 ac) and 2022 (6 ha, 15 ac). In Galveston Island State Park, tidal flats covered 51 ha (127 ac) in 1956, increased to 116 ha (287 ac) in 1979, decreased to 73 ha (180 ac) in 2002, and decreased to only 10 ha (25 ac) in 2022 (Table 3, Figs. 5 and 6).
| Habitat | 1956 | 1979 | 2002 | 2022 | ||||
| ha | acres | ha | acres | ha | acres | ha | acres | |
| Open water | 206 | 509 | 252 | 624 | 261 | 647 | 445 | 1099 |
| Aquatic beds | 26 | 65 | 108 | 267 | 4 | 9 | ||
| Estuarine marsh | 274 | 677 | 174 | 429 | 126 | 312 | 121 | 299 |
| Tidal Flats | 51 | 127 | 116 | 287 | 73 | 180 | 10 | 25 |
| Palustrine marsh | 16 | 39 | 16 | 38 | 5 | 12 | 6 | 15 |
| Fresh OW | 6 | 15 | 13 | 33 | 11 | 26 | 9 | 21 |
| Beach | 28 | 69 | 15 | 36 | 10 | 24 | 12 | 30 |
| Uplands | 351 | 868 | 355 | 877 | 334 | 825 | 318 | 785 |
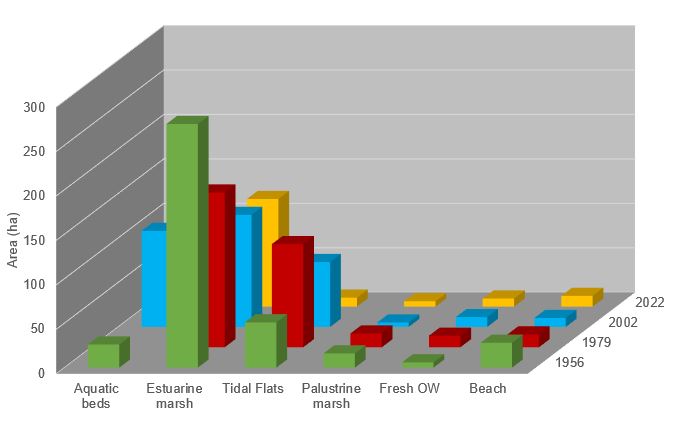
Figure 5. Areal distribution of habitats in Galveston Island State Park in 1956, 1979, 2002, and 2022. Modified from White and others, 2004.
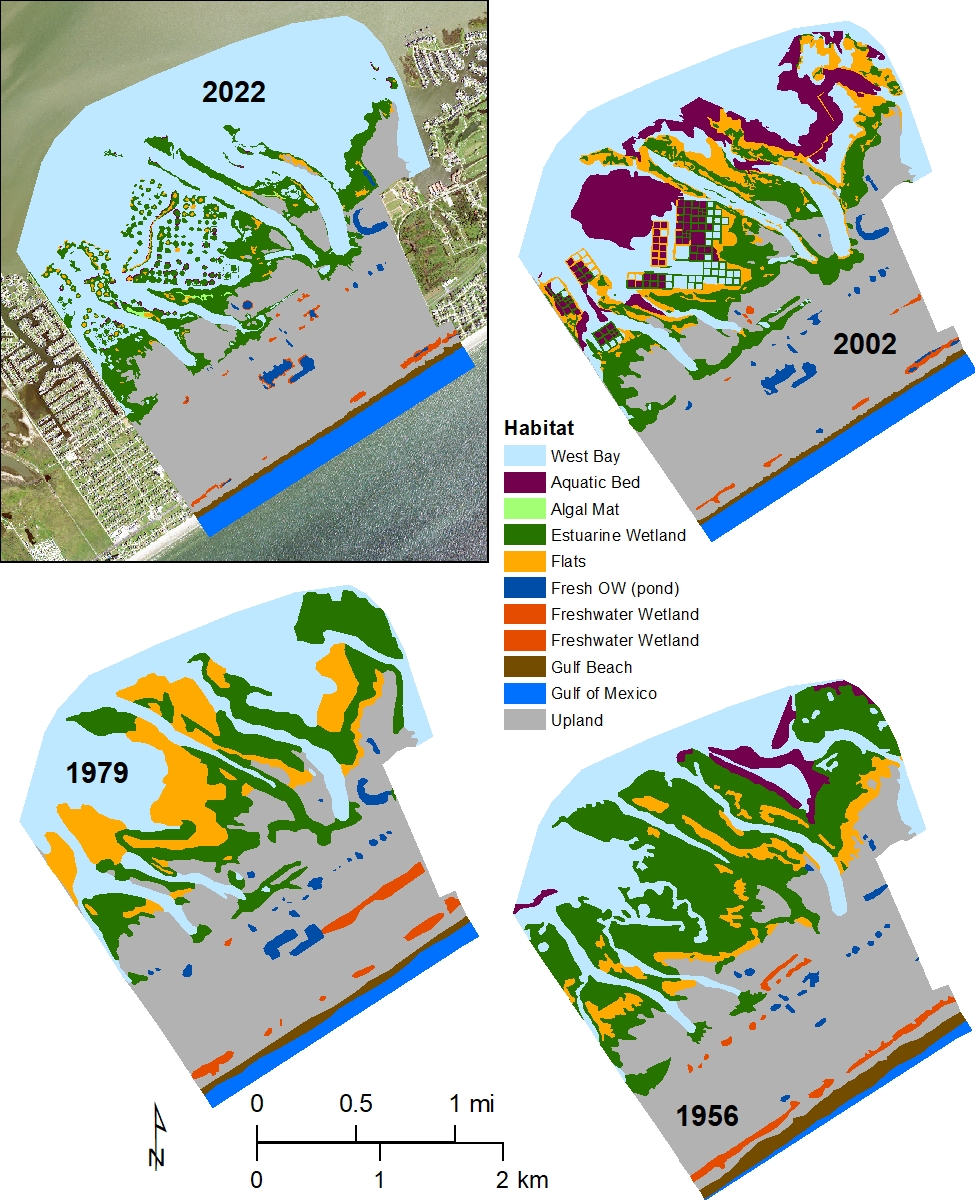
Figure 6. Maps showing distribution of major wetland and aquatic habitats in 2022, 2002, 1979, and 1956 in Galveston Island State Park. Modified from White and others, 2004.
Analysis of trends in wetlands and aquatic habitats in the Galveston Island State Park area show that there was a net decrease in marshes from 1956 through 2022. Emergent wetlands (both estuarine and palustrine) decreased from 290 to 127 ha (716 to 314 ac), a loss of more than half the area of emergent marshes (163 ha, 402 ac, Table 4, Figs. 20 and 21). The long-term (1956-2002) change rate of marsh was a loss of 3.5 ha/yr (8.5 ac/yr). Total emergent marsh habitat was stable between 2002 and 2022. A recurring trend in wetland habitat studies along the entire Texas coast is the loss of tidal flats through time (White and others 2004). Between 1956 and 1979, tidal flat area increased by more than double (Table 4, Fig. 20). Wetlands that were mapped as estuarine marsh in 1956 were mapped as tidal flats in 1979 (Fig. 21). The rate of change for tidal flats between 1979 and 2022 was a loss of 2.5 ha/yr (6 ac/yr). The decrease in estuarine marshes and tidal flats between 1956 and 2022, and the high rates of shoreline retreat, may be due to relative sea level rise flooding the low-lying areas along the bay margin areas of Galveston Island State Park (White and others, 2004, Caudle and Paine, 2024). The shorelines along the communities on either side of the state park have stabilized the shoreline position through bulkheads, fill, and rip-rap (rock walls). Restoration projects and a breakwater have been constructed in Galveston Island State Park in an effort to counteract some of the losses.
Cowardin, L.M., Carter, V., Golet, F. C., and LaRoe, E. T., 1979, Classification of Wetlands and Deepwater Habitats of the United States: U.S. Department of the Interior, Fish and Wildlife Service, Washington, DC. FWS/OBS-79/31.
White, W. A., Tremblay, T. A., Waldinger, R. L., and Calnan, T. R., 2004, Status and Trends of Wetland and Aquatic Habitats on Barrier Islands, Upper Texas Coast, Galveston and Christmas Bays: Bureau of Economic Geology, The University of Texas at Austin, final report prepared for Texas General Land Office, under contract no. 03-057, 67 p.

© Bureau of Economic Geology | Web Privacy Policy | Web Accessibility Policy

