
Zeiss Sigma FEG-SEM
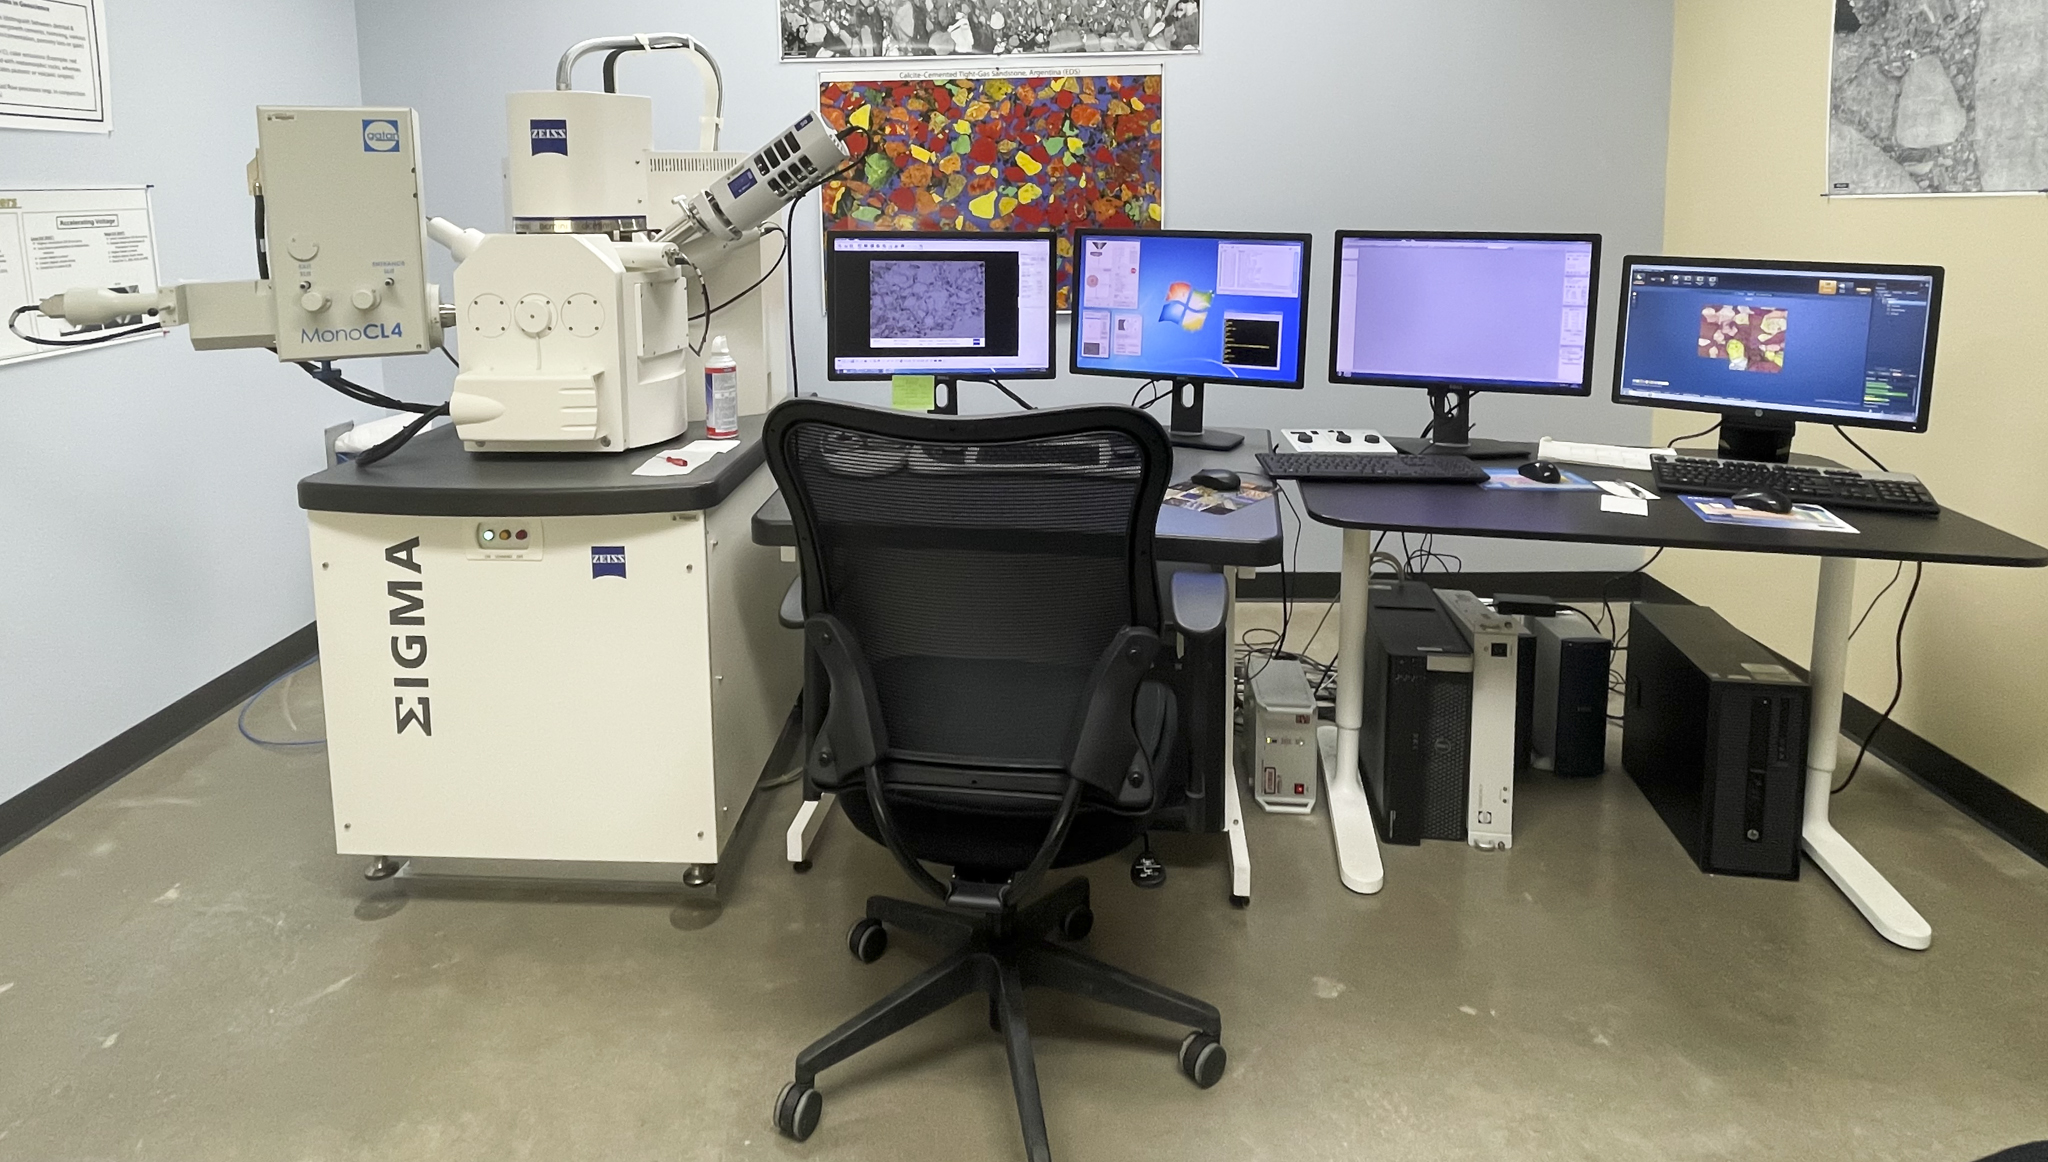
The Zeiss Sigma high-vacuum (HV) FEG-SEM was installed in late 2014 and is specifically configured for high-resolution SE, BSE, EDS, and cathodoluminescence (CL) large-area imaging of geologic and synthetic samples. The Zeiss Sigma is equipped with a GEMINI column designed to work at low kV to minimize sample damage. The large chamber and 5-axes cartesian stage can accommodate large samples. The cartesian stage can cover a 5’’ x 5’’ travel distance for large-area mapping. Under optimal conditions, this instrument provides up to 2 nm spatial resolution. One of the strengths lies on its versatile and state-of-the art CL capabilities. CL is determined by chemistry, crystal structure and defects, strain, and temperature effects on the crystal lattice. The Gatan MonoCL4 system provides crisp panchromatic, monochromatic, and colored-CL images with high spatial resolution. In monochromatic mode, CL spectroscopy can be collected for wavelengths 185-1200 nm. Thanks to the low-kV configuration of this instrument, SEM-CL imaging of carbonate minerals (including calcite!) is possible without imaging artifacts. The Zeiss Sigma is also equipped with a Variable Pressure Secondary Electron (VPSE) detector for Charge Contrast Imaging (CCI), an emission that is poorly understood but that provides information similar to CL. Together, EDS, CL imaging and spectroscopy, and CCI can aid in understanding the nature of the CL emission for a wide variety of applications.
Specifications:
- Spatial resolution: 2 nm under optimal conditions
- Fully automated after initial set up
- Large area mapping using Aztec and Digiscan software
- Acceleration voltage 0.5-30 kV
- Everhart Thornley Detector for Secondary electrons (SE)
- InLens SE and BSE (TLD BSE) detectors
- Angle-selective, pole-mounted backscatter electron detector (AsB)
- Gatan MonoCL4 detector for colored, monochromatic, and panchromatic CL imaging
- CL spectroscopy for wavelengths of 185-1200 nm
- Zeiss VPSE detector for Contrast Charge Imaging (“false” CL)
- Oxford X-Max 50 Silicon 50 mm2 drift detector (SDD) for Energy Dispersive X-Ray Spectroscopy (EDS)
- 5-Axes motorized cartesian stage (X-Y-Z-Tilt-Rotation)
Imaging modes:
AsB (Angle-sensitive Backscatter) detector
This detector is mounted in the pole piece. The number of backscattered electrons produced in an elastic collision between electrons and particles (atoms) depends on the atomic number(Z). BSE provides Z-contrast, channeling contrast (crystallographic and strain information), and qualitative compositional analysis.
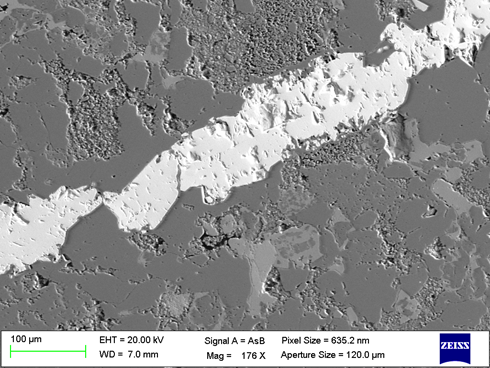
In AsB, grayscale is related to the atomic number (the lighter the higher the Z). Image of barite-filled vein in sandstone.
Secondary electron (SE)
InLens detector (SE1) Secondary electrons are emitted from the top 10nm of the sample surface by initial interaction with the sample. Therefore, this detector provides surface details at low energy. This detector is designed to work at a range of beam energies, between 0.02-20 kV.
Everhart-Thornley detector (SE2) Secondary electrons are emitted after interacting with the topmost layer of the sample. This detector is designed to work at working distances between 5-12 mm and a range of beam energies, between 0.02-20 kV.
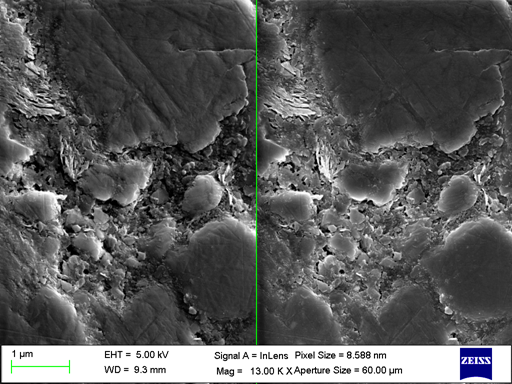
Split-screen image showing the SE1 signal (right) and SE2 signal (left) of the same area.
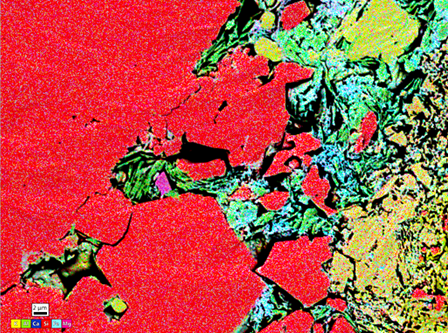
X-ray energy-dispersive spectroscopy (EDS)
The EDS detector is used to separate the characteristic X-rays emitted from the excited sample into an energy spectrum. From this spectrum, the chemical composition of materials can be determined as well as the abundance of specific elements. Image: EDS map showing different elements in different colors.
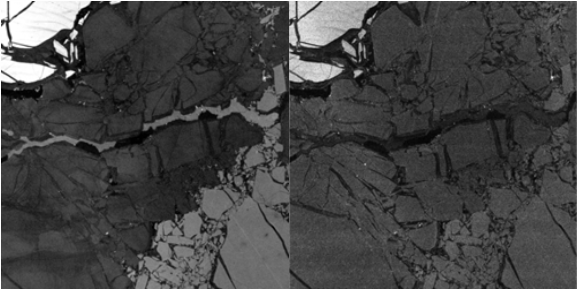
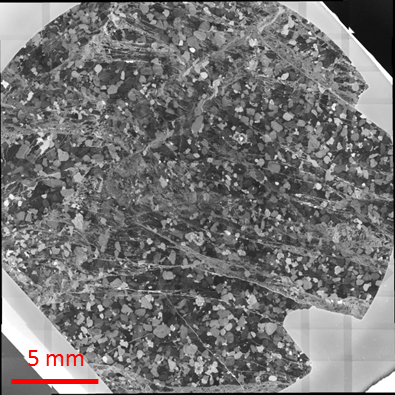
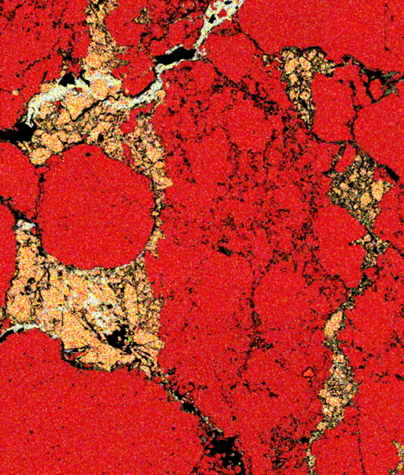
Variable-pressure secondary electron detector (VPSE)
This detector collects photons that are produced when a gas molecule is ionized, therefore it is designed specifically to work in a gaseous environment. VPSE imaging shows how different areas of a sample dissipate charge. It detects defects in a similar way to CL, but the signal is generated from a smaller interaction volume (higher resolution). Image: Whole-rock image of sandstone cataclasite outcrop plug.
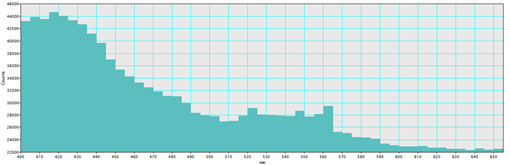
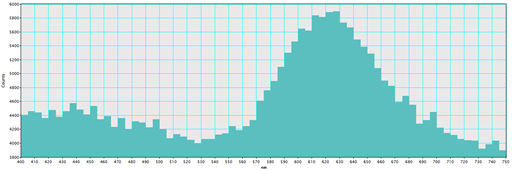
Monochromatic CL spectra
Our MonoCL4 detector can be set to spectrum-imaging mode. Each material emits a characteristic spectrum that can be used to distinguish between materials. The intensity of the photons emitted at each wavelength is recorded. Image: comparison between CL emission spectra within a deformation band and adjacent undeformed host rock.
Cathodoluminescence (CL) MonoCL4 detector
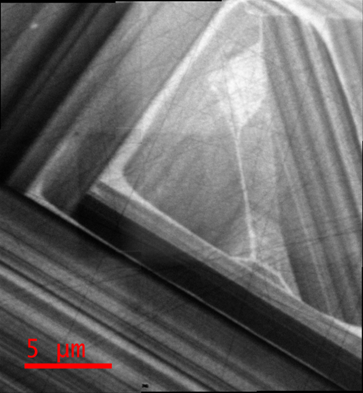
CL signal is produced when atoms bombarded by electrons return to the ground state and emit photons. CL signal depends on composition, lattice structure, and lattice damage. CL is useful for discerning cements and microfractures. Image: panchromatic CL image of a zoned zircon.
Color CL
Color CL images can be constructed by combining three images of the same area collected using a blue, green, and red filter.
Large-area mapping (SE1, SE2, AsB, VPSE, CL, and EDS)
Large-area mapping enables the collection of high resolution images automatically. Aztec software (Oxford Instruments) is used for large-area EDS mapping, whereas Digiscan (Gatan) is used for CL images collected with the MonoCL4 detector. Either one of the two softwares can be used for large-area mapping of the Zeiss detectors (SE1, SE2, AsB, VPSE). Simultaneous maps can be collected in a single run.
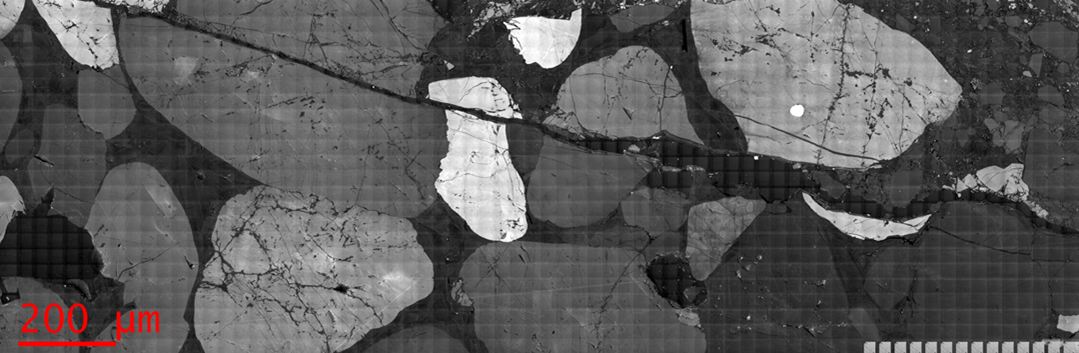
Panchromatic CL image of a fractured tight-gas-sandstone composed of 1840 images. Stitching is automatic using Digiscan software. Inset of imaged area is composed of 12 tiles. We can routinely acquire images with a resolution of 10 nm per pixel.
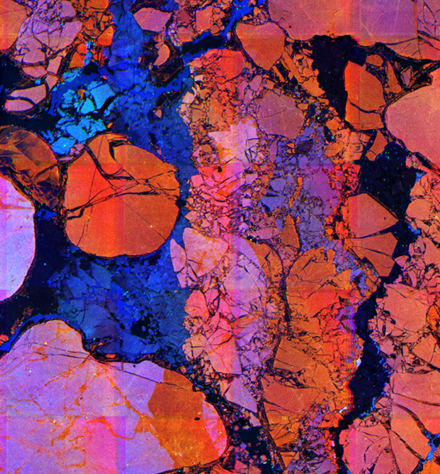
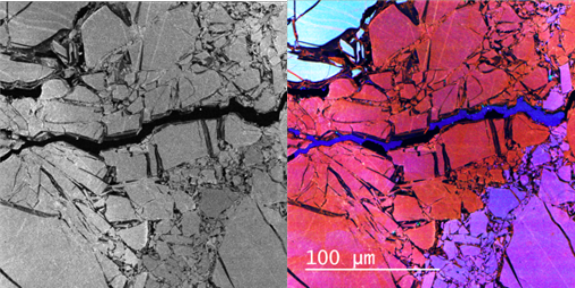
Color-CL mosaic composed of 49 images of a deformation band in sandstone. Stitching and image superposition is performed in Digiscan.
Seamless EDS mosaic of the same area displayed in the image to the above. EDS mosaic composed of 20 images. Automated image acquisition and seamless stitching performed by Aztec.
For training and using this tool, please contact Sara Elliott.
For inquiries on the instrumentation and capabilities please contact Esti Ukar.

