Beach and Dune Analysis Using Chiroptera Imaging System, South Padre and Brazos Islands, Texas Gulf Coast
Project Summary
Researchers from the Bureau of Economic Geology (BEG) acquired lidar data and color infrared (CIR) aerial imagery of South Padre Island and Brazos Island, Texas (Mansfield Channel to Rio Grande) on February 4 and 5, 2013. The data collected has been used to (1) evaluate position and change rates of the shoreline, position of the vegetation line, and dune-crest elevations; (2) map geomorphic units; and (3) provide beach and dune system volume analysis. Data were collected using the BEG's new airborne system (Chiroptera), which collects topographic lidar data, shallow bathymetric lidar data, and high-resolution natural color/color infrared imagery. Topographic data and CIR images were collected for a 500-m swath (three passes) of South Padre Island and Brazos Island (71 km length) landward of the shoreline. Bathymetric data were collected from the shoreline 1000 m seaward. This project is intended to establish the depth-penetration and water-clarity limitations of Chiroptera on the open Gulf of Mexico coast.
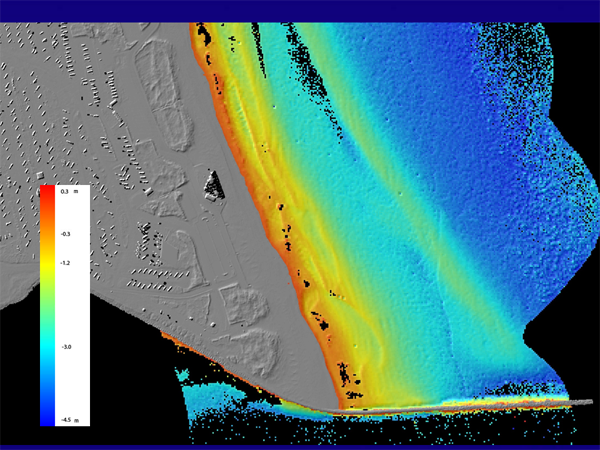
Figure 1. Merged topographic and bathymetric lidar digital elevation model (DEM) of South Padre Island and nearshore environment adjacent to north jetty at Brazos Santigo Pass (Isla Blanca County Park).
Change Rate Analysis
On average, long-term shoreline change trends are erosional for South Padre Island and Brazos Island. The average rate of shoreline retreat between 1937 and 2013 was 2.2 m/yr (7.2 ft/yr) (Fig. 2). The Gulf shoreline between Mansfield Channel and the Rio Grande is retreating at 84% of the monitoring sites. Areas of advancing shorelines are concentrated adjacent to the jetties at Mansfield Channel and Brazos Santiago Pass. Maximum long-term retreat is found at the mouth of the Rio Grande and in the central portion of South Padre Island. Rates decreased over the last decade (2000 to 2013) to 1.1 m/yr of retreat (76 percent of sites retreating). The trend changed between 2010 and 2013 with 64 percent of monitoring sites advancing at an average distance of 4.9 m.
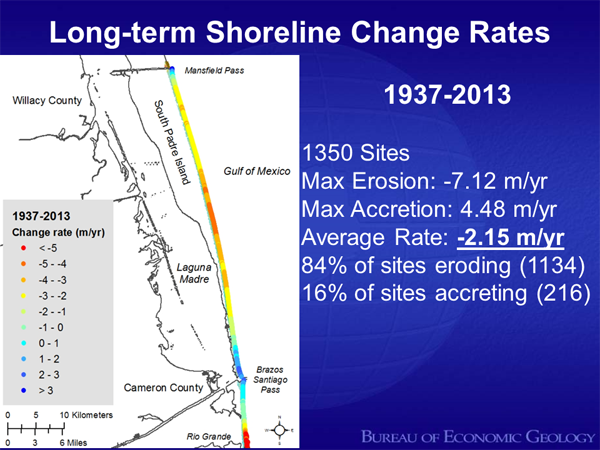
Figure 2. Long-term net shoreline change between 1937 and 2013 from Mansfield Pass to the Rio Grande. Change calculated from shoreline positions determined from aerial photography and airborne lidar surveys. Positive values indicate shoreline advance; negative values indicate shoreline retreat.
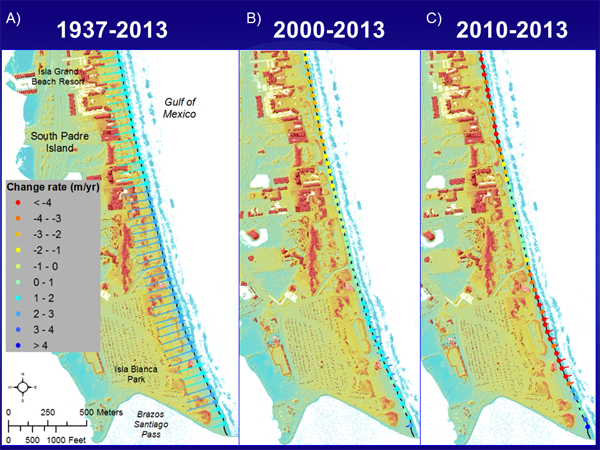
Figure 3. Net shoreline change rates at southern end of South Padre Island: A) long-term, 1937–2013; B) decadal scale, 2000–2013; and C) short-term, 2010–2013. Change calculated from shoreline positions determined from aerial photography and airborne lidar surveys. Positive values indicate shoreline advance; negative values indicate shoreline retreat.
Data Download
2013 GIS files
- Shoreline [FEB2013_SPI_Shoreline.zip]
- Potential Vegetation Line [FEB2013_SPI_PVL.zip]
- Back Dune Line [FEB2013_SPI_DuneLine.zip]
- Dune Crest Elevations [FEB2013_SPI_DuneCrest.zip]
- Geomorphic Units [RatesSPI1937-2013.zip]
- Beach/Dune Volumes [1.87 Mb zip]
- Long-term Shoreline Change Rates [0.59 Mb zip]
Presentation