
Drone Capabilities
Introduction
Unmanned, semi-autonomous robots represent the present and future of… everything? Home delivery, search and rescue, infrastructure monitoring, and data collection for scientific inquiry are facilitated by autonomous robotic devices including UAVs, unmanned aerial vehicles. As prolific collectors and users of near-surface geoscience data, Bureau researchers have conspicuous need for near-surface platforms from which to acquire said data, and UAVs provide that platform from heights of 10 to 120 meters above ground level (AGL). From the scientist’s perspective, UAVs are merely sensor platforms, and their utility is confined to the sensors they’re capable of sustaining in flight. Advances in both UAV and sensor technologies, however, ensure expanded access for scientists to ever-more powerful and affordable data collection tools. Bureau scientists currently employ UAV technology for the following applications:
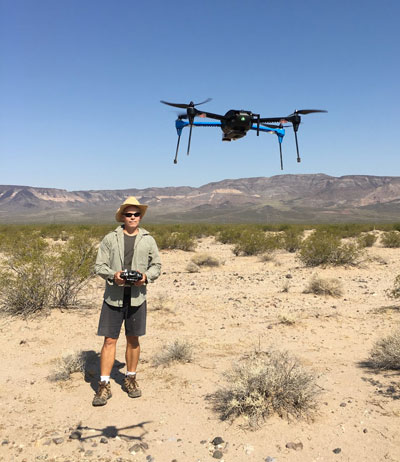
Desert drone flight with 3DR IRIS+ UAV and GoPro camera circa 2017.
General Mapping
The hundreds of RGB images routinely captured in a single drone flight can easily be assembled to make suitable orthomosaic base maps for a variety of geoscience studies. Taking advantage of unprecedented resolutions—from centimeter- to millimeter-levels of precision, depending on project demands—geomorphic, vegetative, mineralogic, and hydrologic landscape features once indiscernible in aerial images are now routinely imaged and mapped.
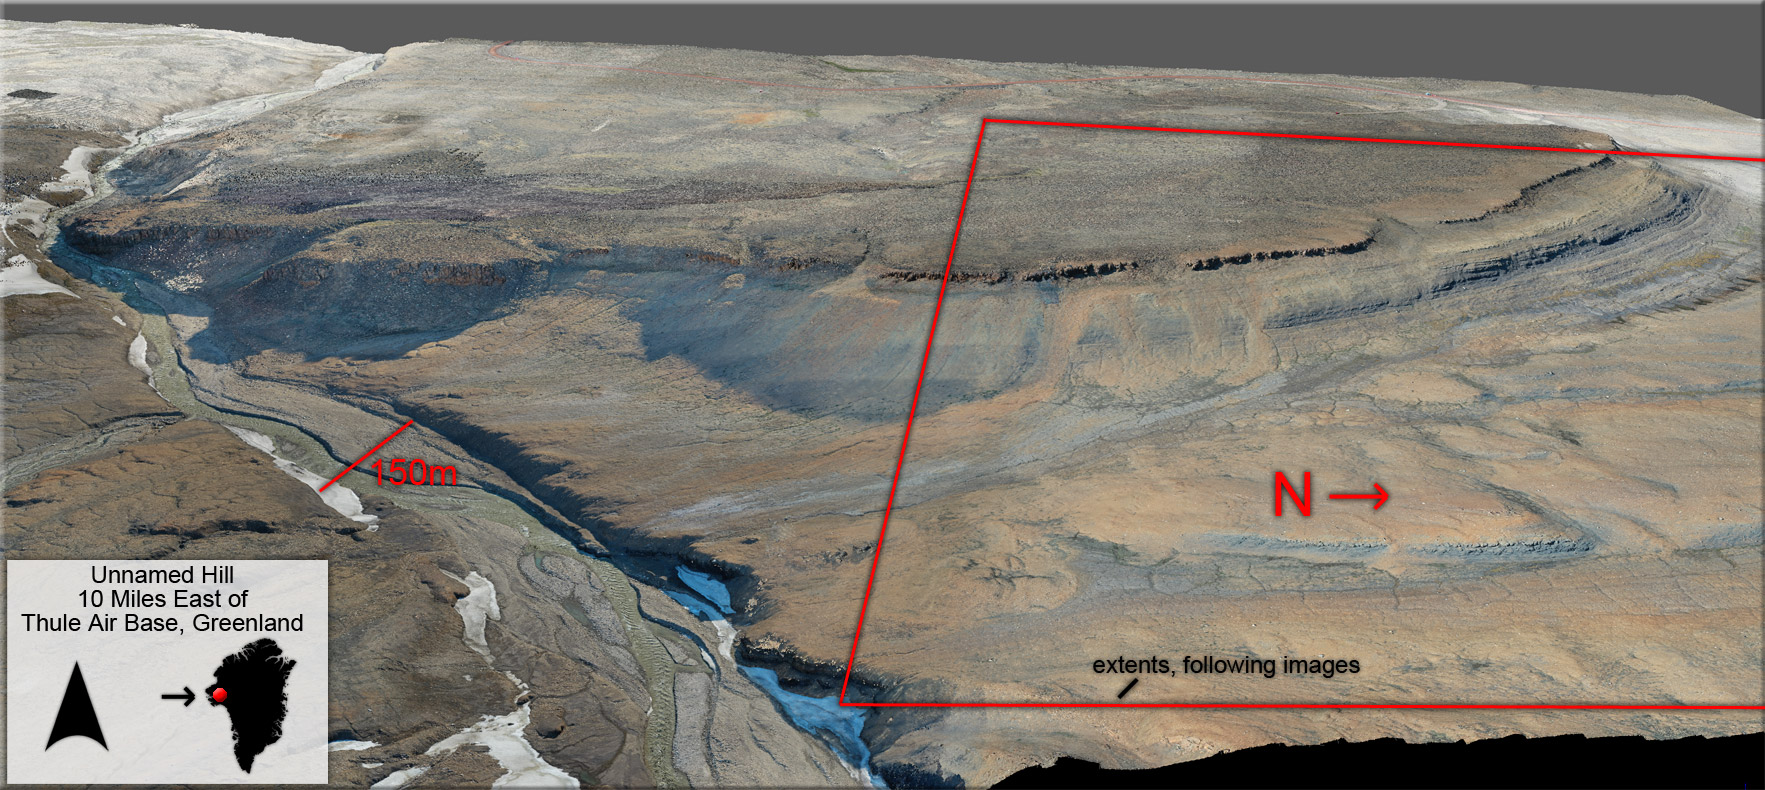
3D topographic model and photo drape of a hill in NW Greenland generated from a mosaic of 6,700 twenty-megapixel RGB photos taken from 120 meters AGL (above ground level). [click image to enlarge]
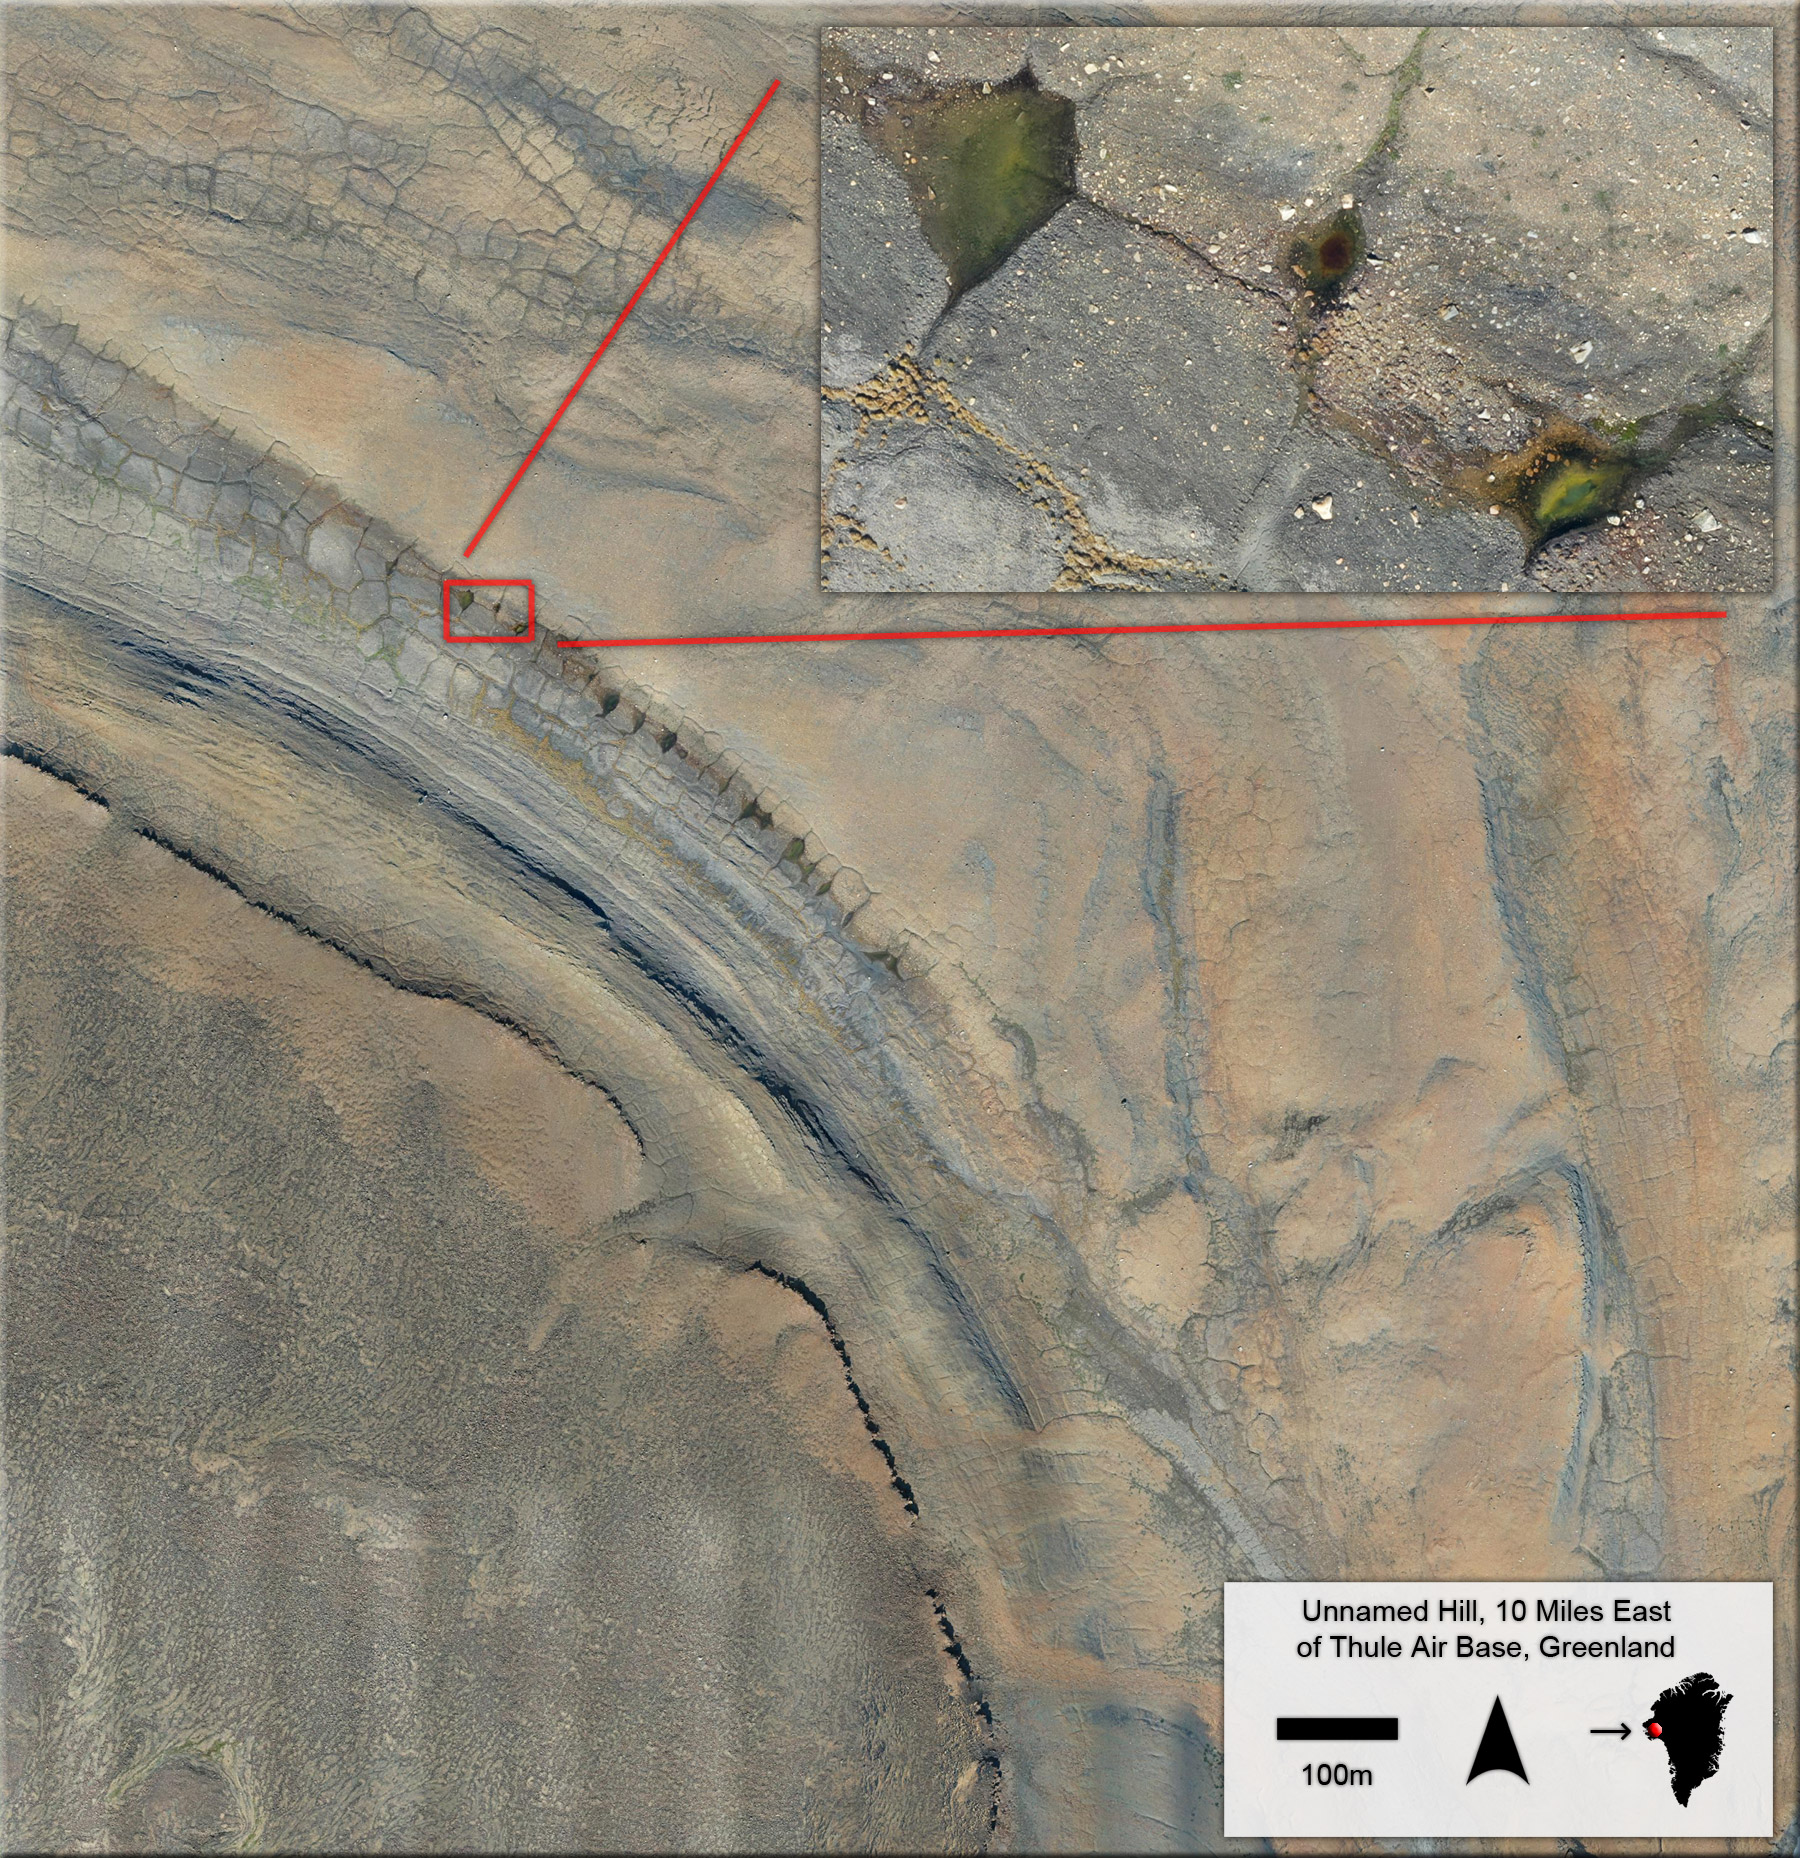
Mapview orthomosaic image. Inset image reveals astonishing feature clarity within this 5cm resolution geospatial dataset. [click image to enlarge]
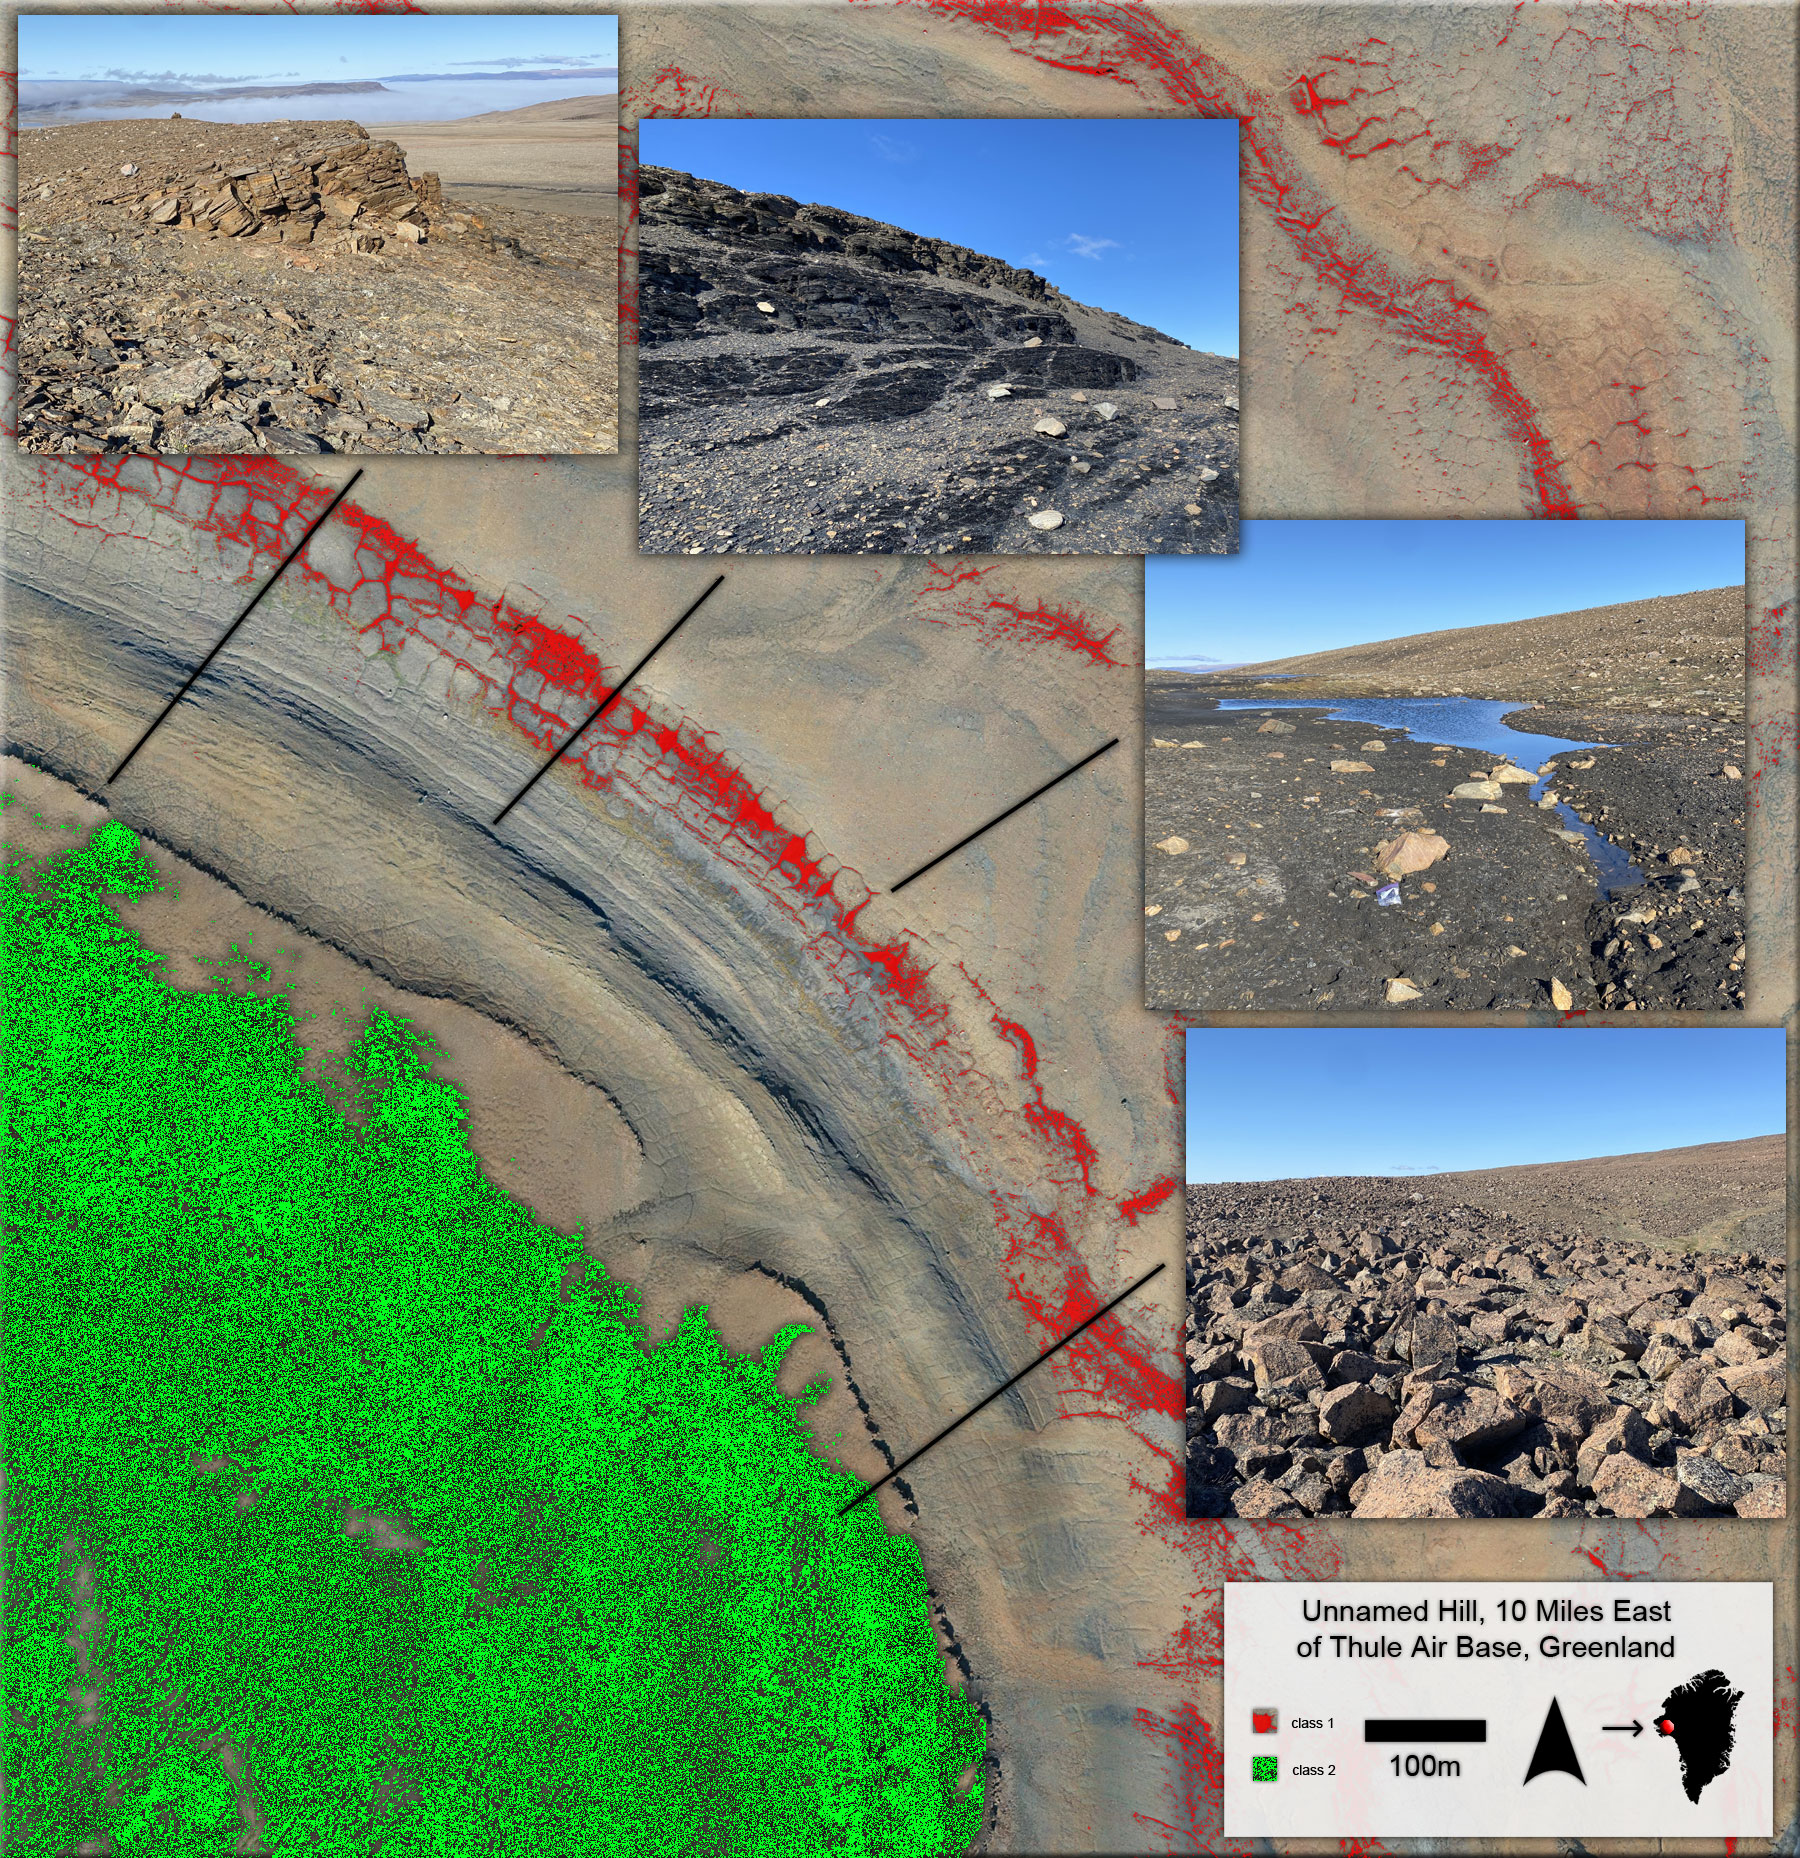
Classification algorithms applied to drone-derived datasets—including orthomosaics and DEMs—assist geoenvironmental mapping efforts. In this image low-elevation, organic-rich polygonal drainages (red) and a mesa-perched igneous boulder field (green) are identified via supervised classification methods. [click image to enlarge]
Topographic Mapping
Digital photogrammetry—especially structure from motion (SfM) techniques—enable geoscientists to generate accurate, precise terrain models from series of overlapping images. The camera’s azimuth and position are recorded for each image during flight. Back in the lab, software is employed to merge images using this location and orientation information and pattern-matching algorithms to identify common features imaged in overlapping photos. Necessarily, every feature in the target area—small shrubs, abandoned bottles, sidewalk corners, highway centerlines, etc—must be captured in multiple images, enabling the software to determine each feature’s distance from the multiple camera locations. From this information—camera location, camera orientation, and feature distance from cameras—a digital terrain model is generated. If ground control points (GCPs) are collected, they can be included in the processing steps to improve spatial accuracy. High resolution terrain models are essential datasets for a wide variety of earth science inquiry including beach morphology studies, fault monitoring efforts, subsidence studies, and sinkhole monitoring, among many other uses and applications.
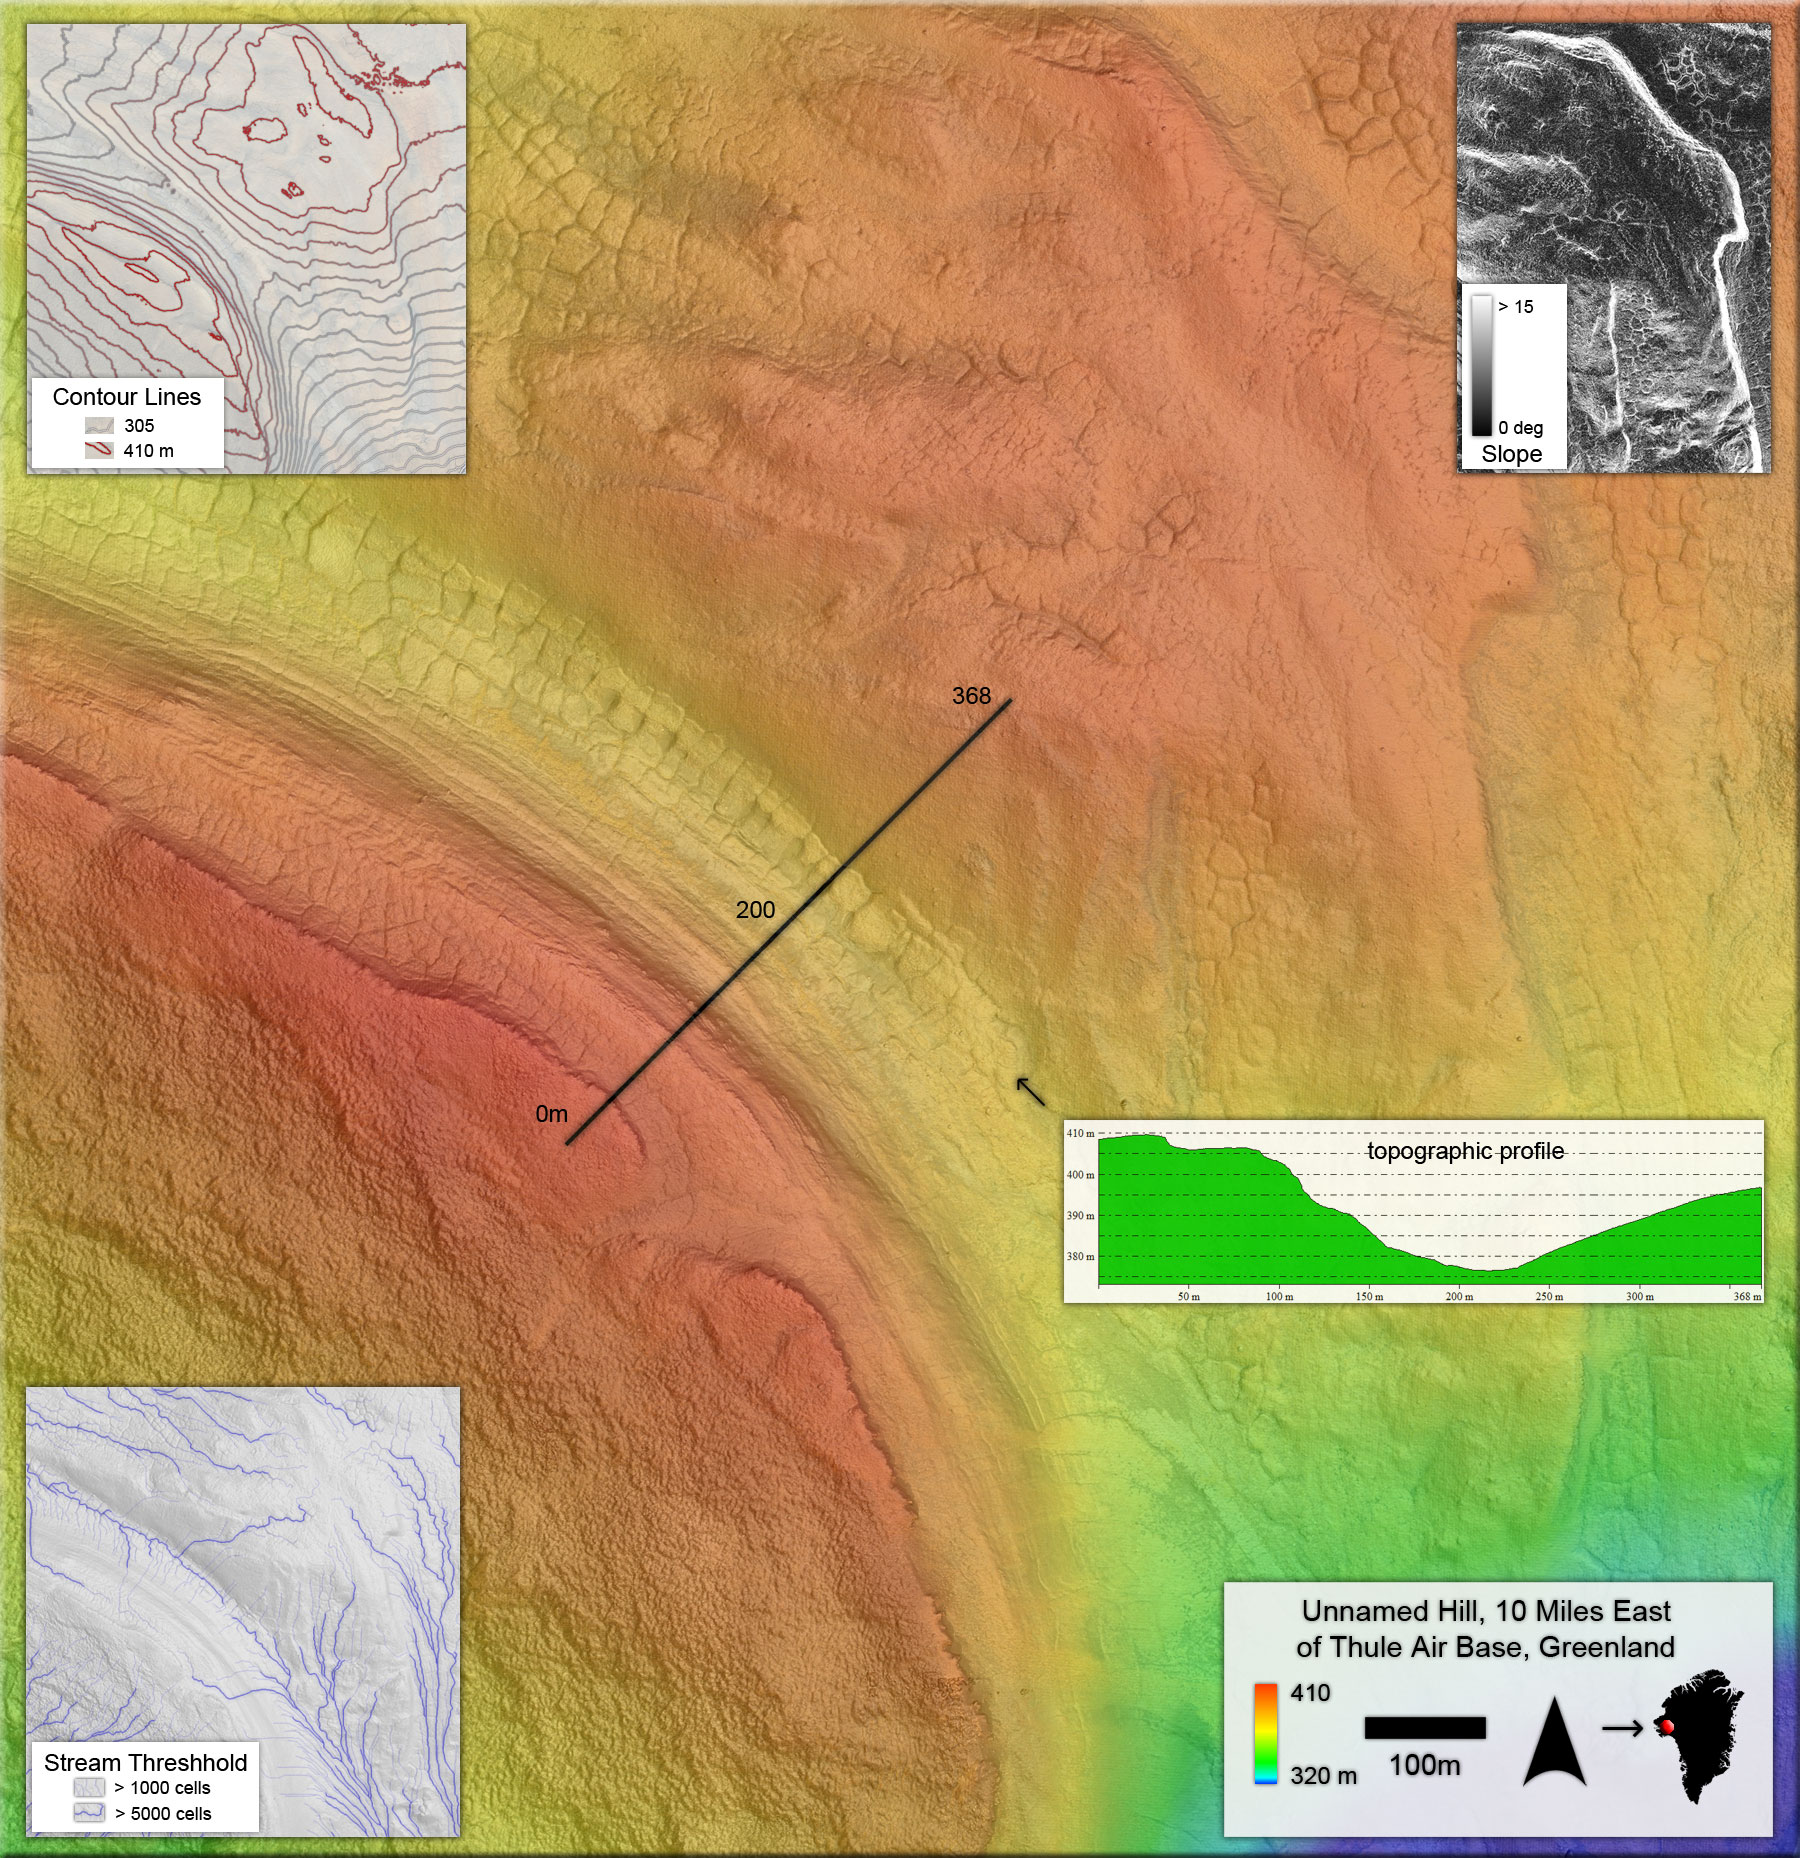
Digital photogrammetry enables construction of precise and accurate DEMs (digital elevation models) from series of overlapping images. Slope, aspect, curvature, viewshed, stream delineation, and topographic profiles are just a few of the derivative products and analytical techniques available with DEMs. [click image to enlarge]
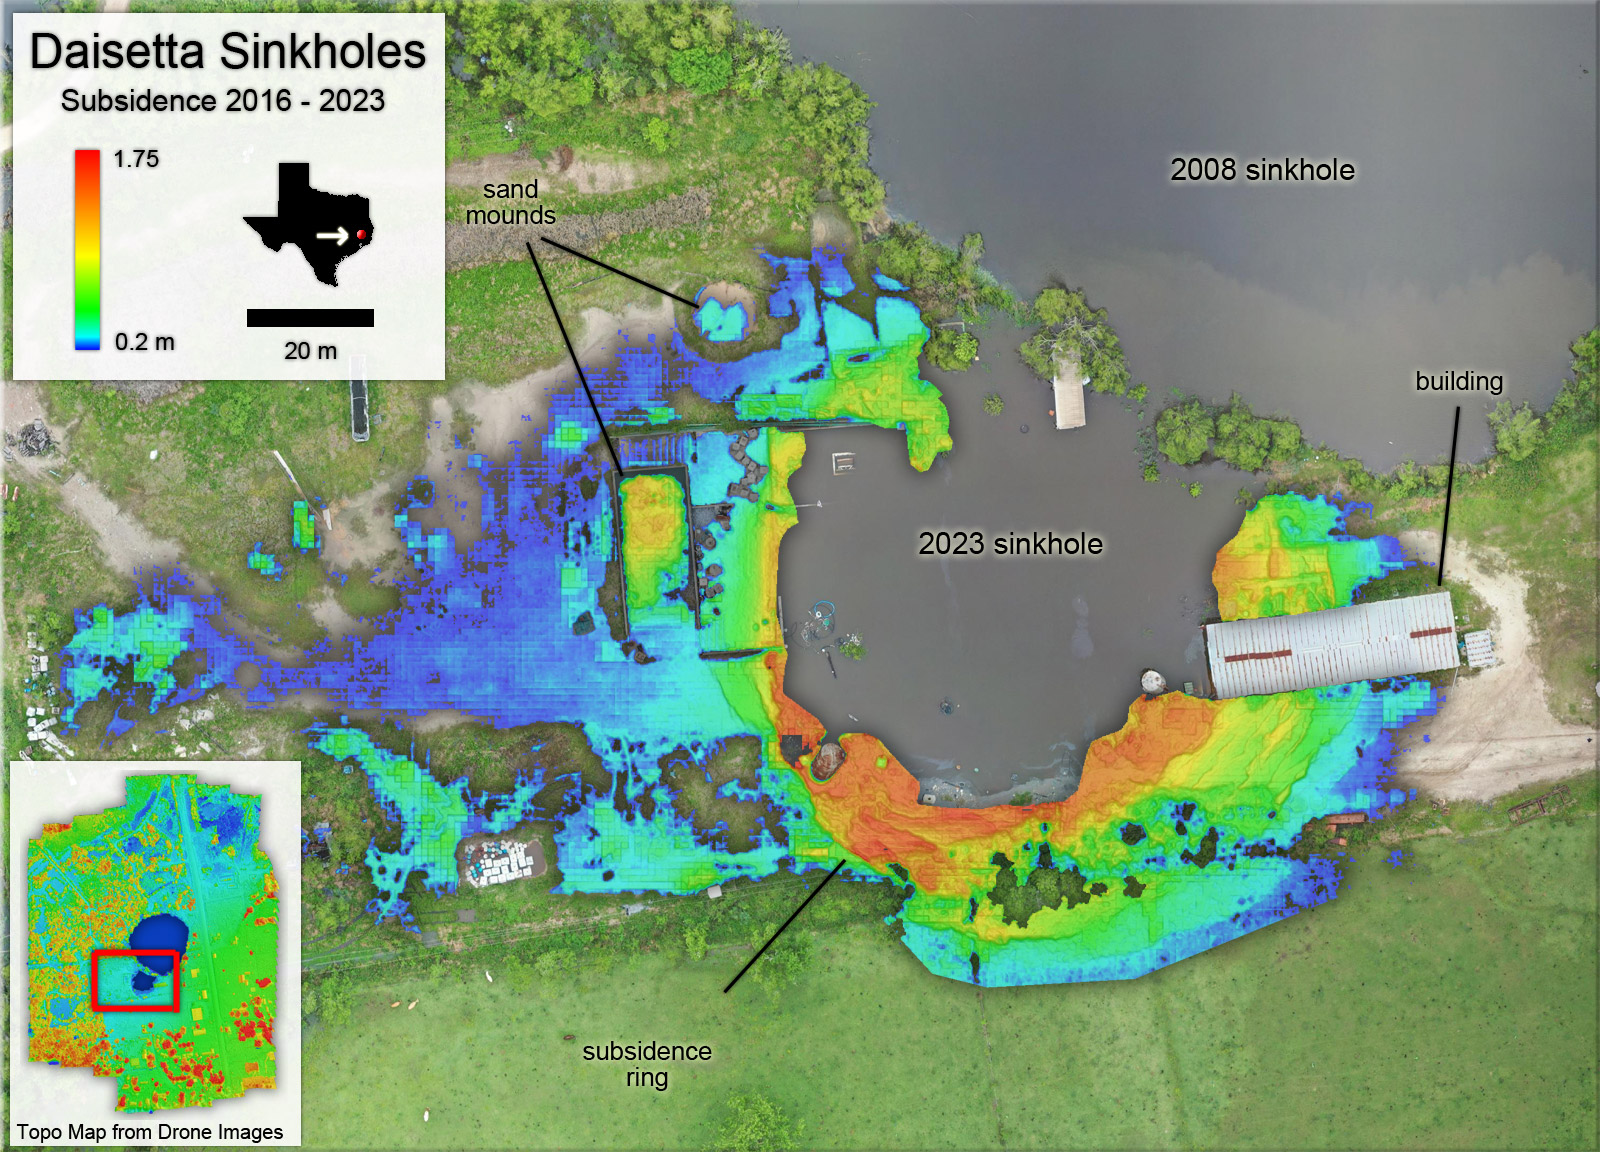
The large sinkhole at Daisetta first appeared in 2008; a second, adjacent sinkhole formed in April 2023. Within a week of its formation, Bureau scientists visited the site to take geophysical measurements and capture drone-based imagery to build the precise topographic model shown above, lower-left inset (Paine and others, 2023). We compared this topographic data to a lidar-based terrain model produced in 2016 to quantify subsidence around the sinkholes from 2016 to 2023. [click image to enlarge]
Field Measurements
It is not uncommon for researchers to monitor the efficacy of classification algorithms—applied to vegetation, soils, lithology, minerology, etc—with site visits to ensure field measurements align with predicted or modelled results. Images captured via drone at intermediate scales—between regional-scale airborne imagery and in-situ field measurements, for example—can provide the requisite precision to visually identify feature details against which the regional-scale classification efforts can be monitored, yet provide orders of magnitude more samples compared to in-situ field measurements. In our example below, approximately 40 shrubs were classified and mapped (red dots) over two hours by researchers in the field. A twenty minute drone flight, for comparison, can image thousands of shrubs with a precision enabling near-100% accuracy in visual species identification back in the office on computer (image below). So, compared to traditional field work, data capture via drone can provide additional or alternative methods for tweaking classification algorithm parameters and improve results.
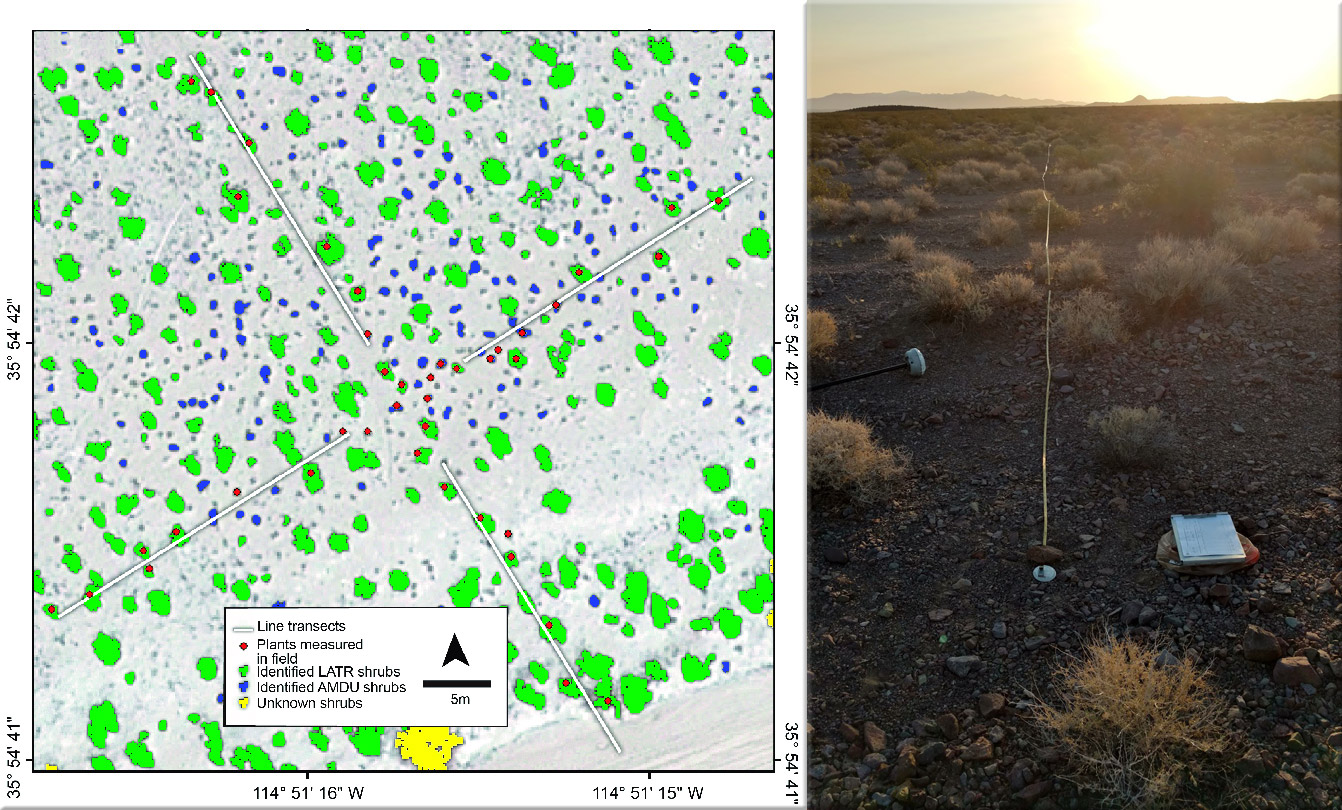
Bureau researchers developed classification algorithms to identify vegetation species type and baseline morphological characteristics from high altitude (>3000m AGL) airborne imagery within a 35,500 hectare study area in the Sonora desert southeast of Las Vegas (Young and others, 2017). Two methods were employed to validate this process: first, we conducted field measurements along transects in which intersected shrubs’ height, location, and species were recorded.
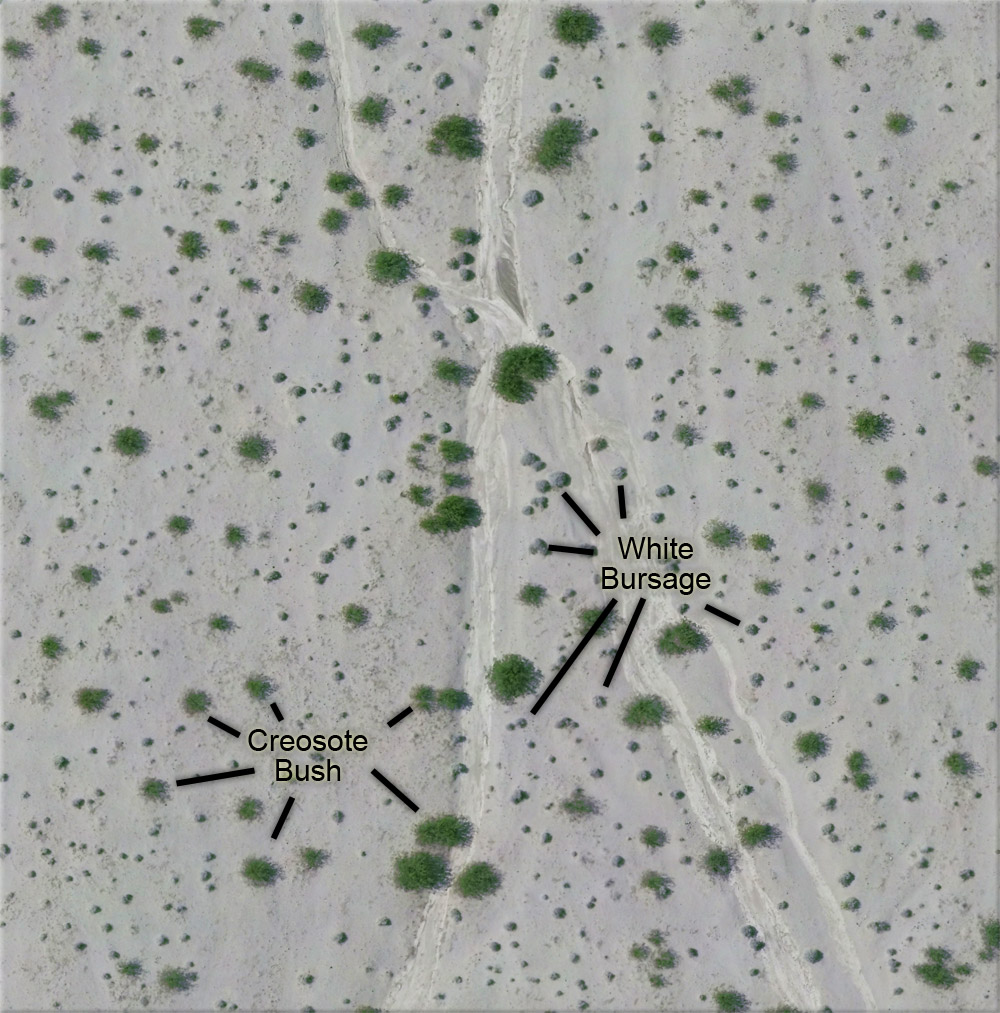
We also flew drone surveys over the field sites. As shown here, the drone images are suitable for species identification and lateral measurements. We used these intermediate-scale data to test the integrity of the classification algorithms run on the smaller-scale airborne imagery.
Outcrop Capture and Modelling
Detailed digital outcrop models from SfM-derived surfaces enable precise and accurate geologic mapping in three dimensions. Before digital photogrammetry, conventional photography was used to take variable-scale imperfect photos of outcrops, and geologists used these photos to interpret and map faults, formations, facies, and other features of interest to geoscientists. But the mapping and interpretation--as with the underlying 'basemap' photos--were not in real-world space, scales were approximate and variable across the photos, and the location and orientation of features within the photos were likewise approximations. But using the same data capture and processing techniques described above—albeit with images captured from oblique rather than map-view orientations—detailed vertical surface structures and precise image mosaics (<5cm precision) provide geologists unparalleled data for 3D geologic mapping. These models and interpretation can be correlated to subsurface data including geophysical well logs, drillers reports, and seismic data.
Here we see complex geometries—vertical walls and overhangs—reconstructed via digital photogrammetry from oblique, overlapping, drone-based images. This 3D outcrop model is shown from multiple viewpoints to illustrate the three dimensional nature of the data.
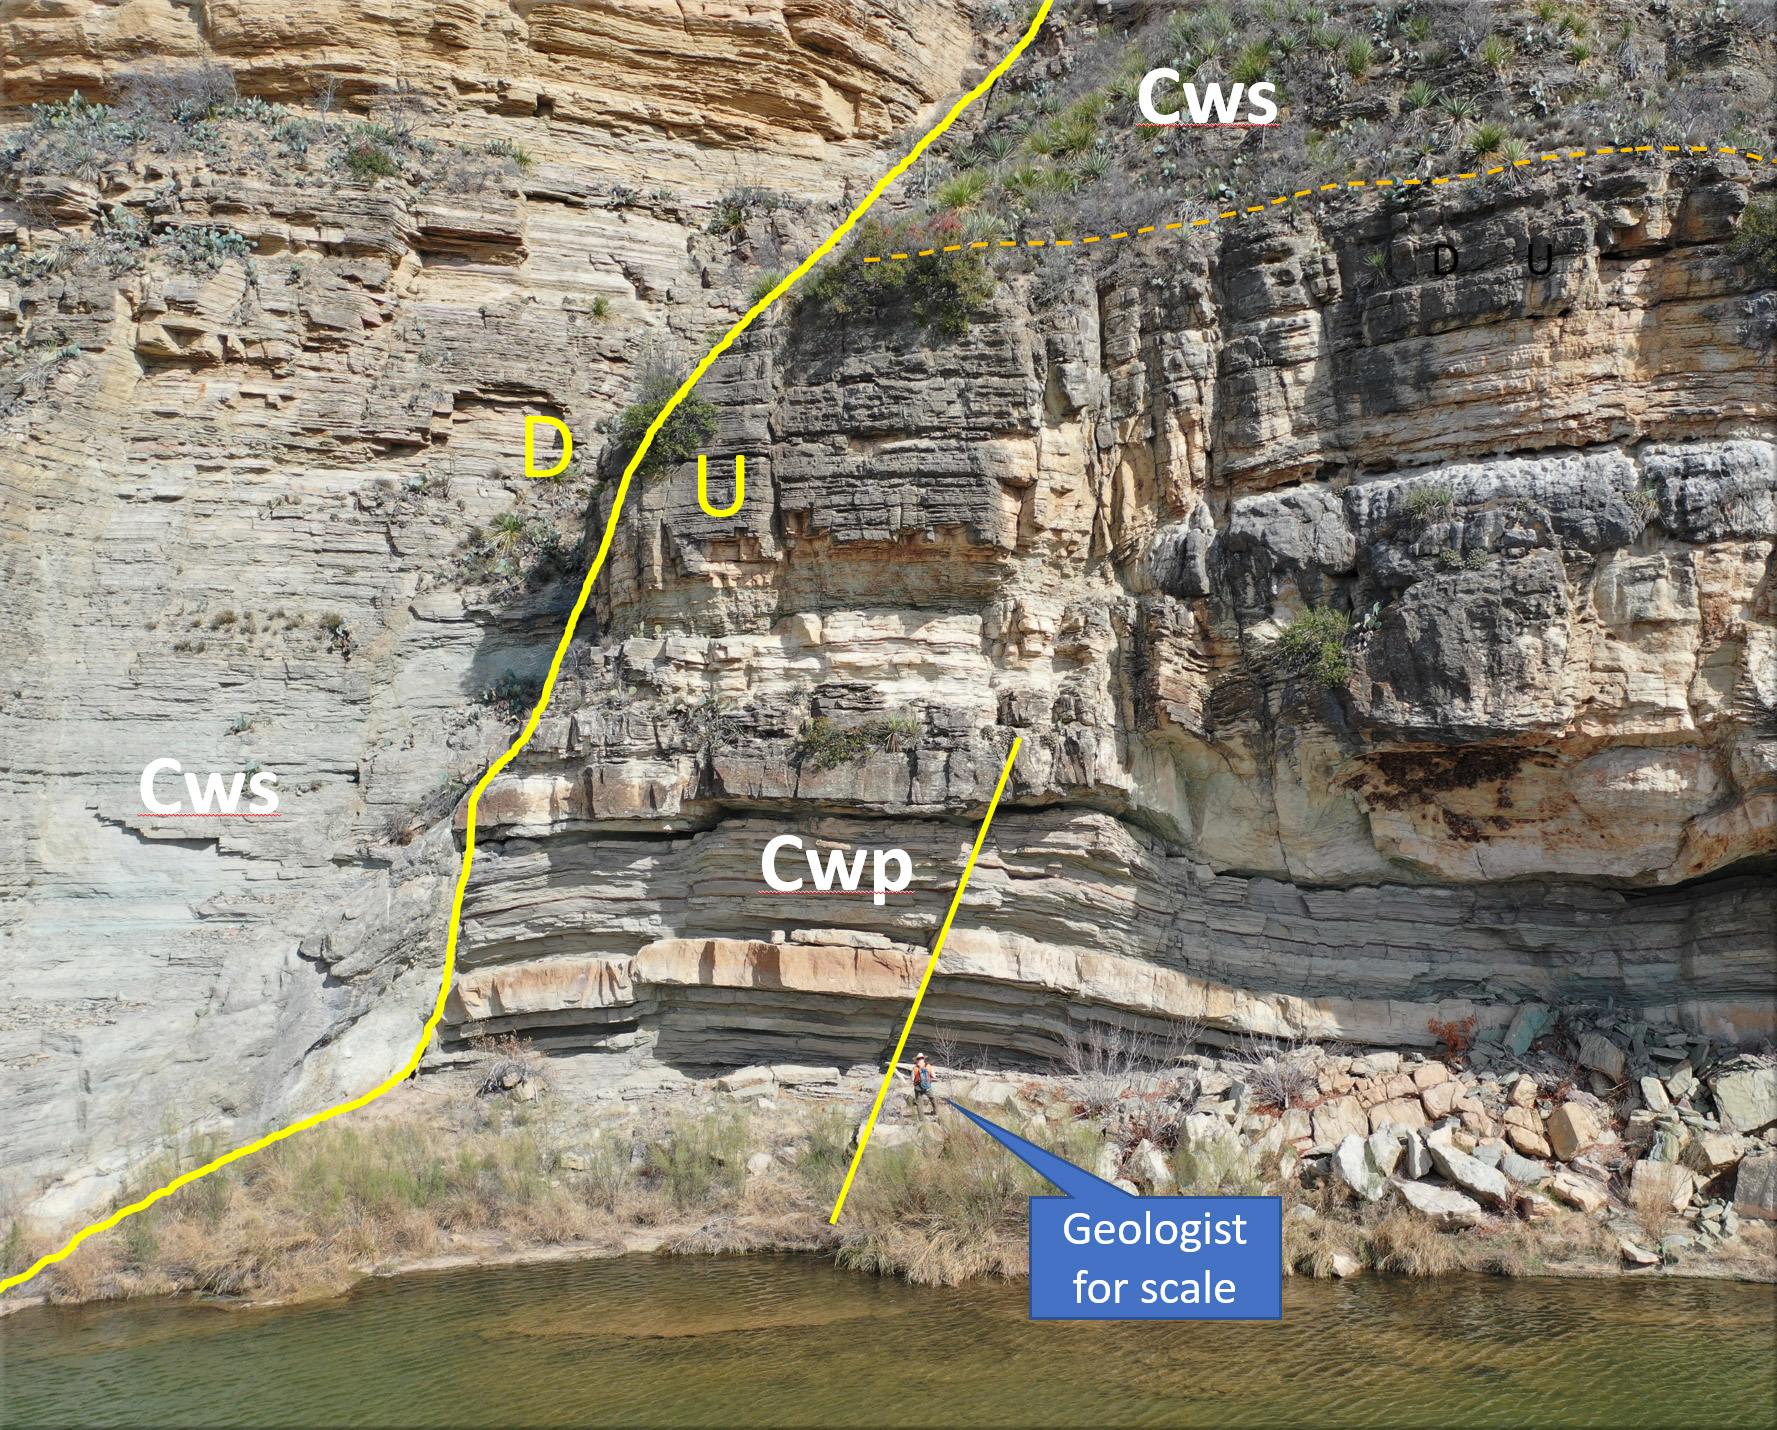
Late Paleozoic normal fault zone in Mason County along the James River. The fault zone juxtaposes the San Saba (Cws) and the underlying Point Peak (Cwp) members of the Cambrian-age Wilburns Formation of the Moore Hollow Group. As shown, images captured via drone and digital photogrammetry enable unprecedented opportunities for 3D geologic mapping.
Additional Sensors
Bureau researchers deployed a FLIR (forward-looking infrared)-equipped UAV recently to monitor spring flow in the Devils River watershed. Temperature gradients and spring inflow are evident in the image, below left. The image to the right is a standard RGB orthomosaic of the same area. Lidar, hyperspectral, magnetometer, and other geophysical sensors are on our deployment horizon as sensor size, weight, and affordability continue to evolve.
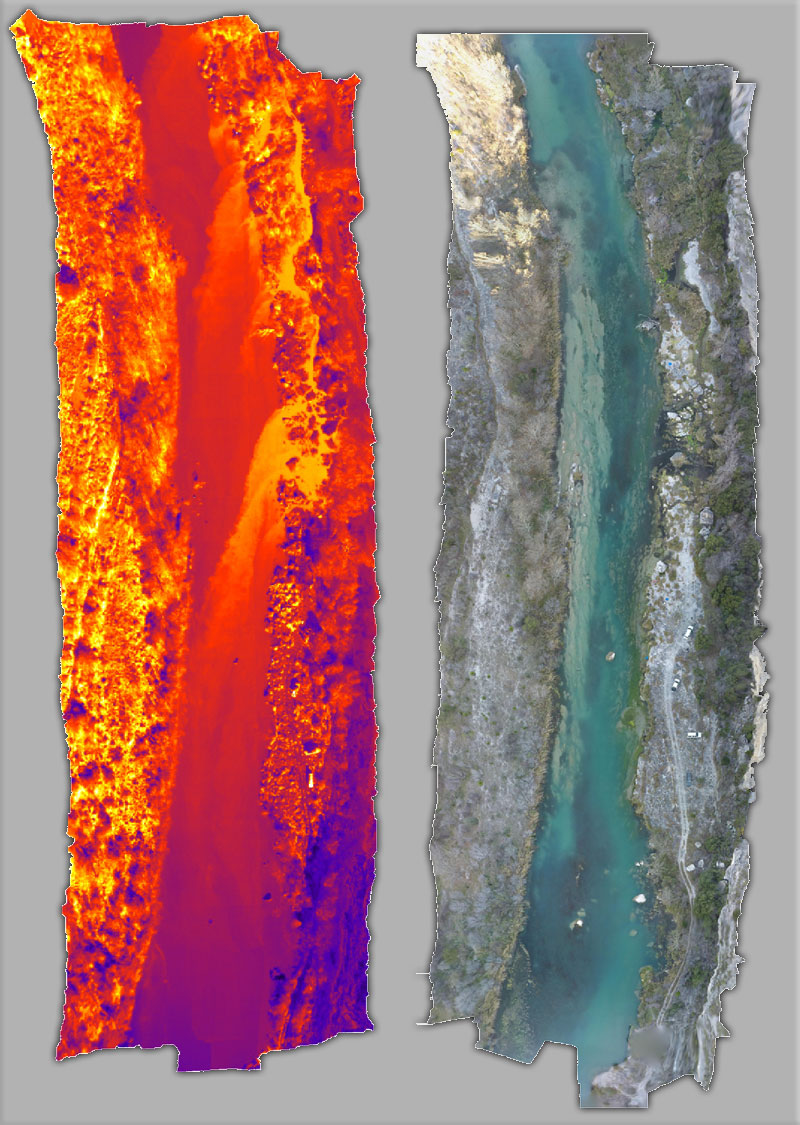
The left image—a mosaic of FLIR photos captured via drone—depicts water surface temperature gradients on the Devils River, February 2017 (Abolt and others, 2018). Warmer spring water—approximately 22 degrees Celsius—exits conduits on the right side of the image into the colder river. The right image is an orthomosaic generated from RGB images captured in a second drone flight.
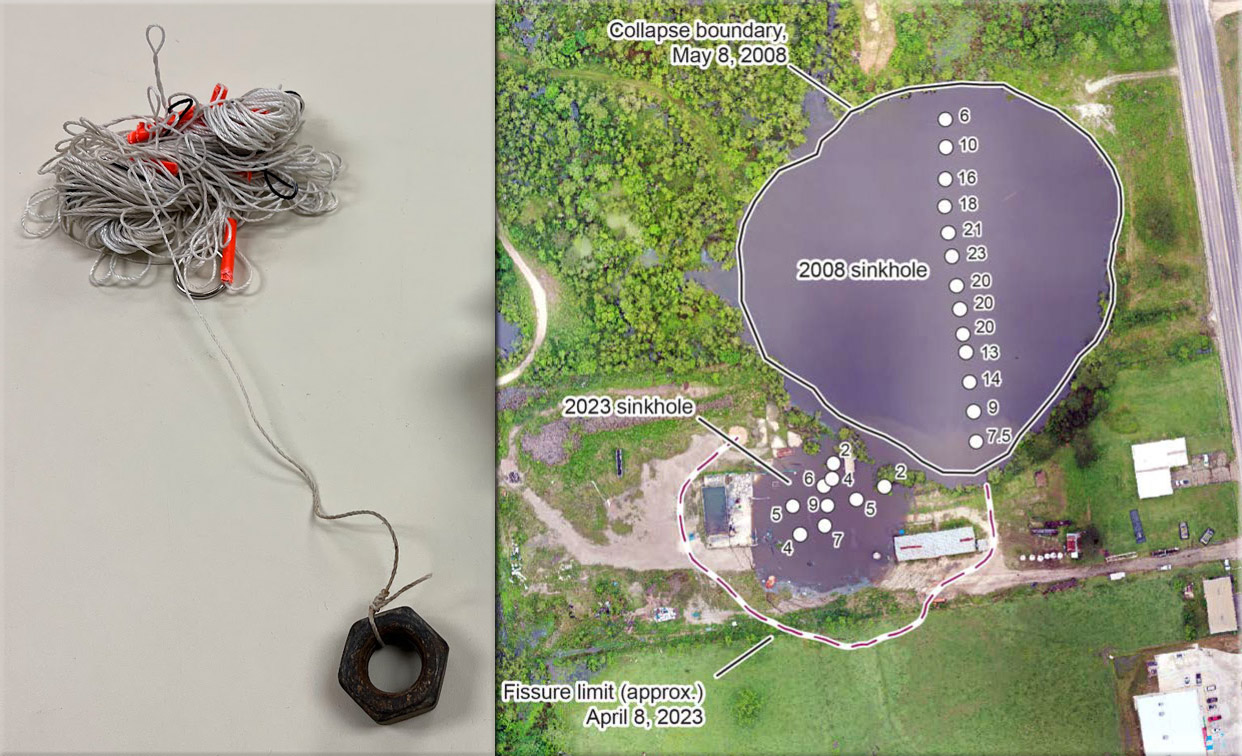
This sophisticated piece of equipment (left)—a graduated, weighted string—was used to measure water depths in the Daisetta sinkholes (Paine and others, 2023). Suspended from a hook beneath our drone, the string was dipped into the water at multiple locations (right) while binocular-equipped researchers recorded measured depths from shore. Depth in meters.
References
Abolt, C., Caldwell, T., Wolaver, B., and Pai, H., 2008, Unmanned aerial vehicle-based monitoring of groundwater inputs to surface waters using an economical thermal infrared camera: Opt. Eng. 57(5), 053113 (2018), https://doi.org/10.1117/1.OE.57.5.053113
Paine, J. G., Andrews, J. R., Morris, J. N., Saylam, K., and Kyle, J. R., 2023, Airborne and ground surveys of the April 2023 Daisetta sinkhole, Liberty County, Texas: The University of Texas at Austin, Bureau of Economic Geology, Open-File Report 23–1, 16 p, https://doi.org/10.23867/OFR23-1
Young, M.H., Andrews, J.R., Caldwell, T.G., Saylam, K., 2017, Airborne lidar and aerial imagery to assess potential burrow locations for the Desert Tortoise (Gopherus agassizii). Remote Sens., 9, 458. https://doi.org/10.3390/rs9050458

