
High-resolution mapping of spatial heterogeneity in ice wedge polygon geomorphology near Prudhoe Bay, Alaska
Charles J. Abolt and Michael H. Young
Nature Scientific Data, v. 7, no. 87 https://doi.org/10.1038/s41597-020-0423-9
Study Summary
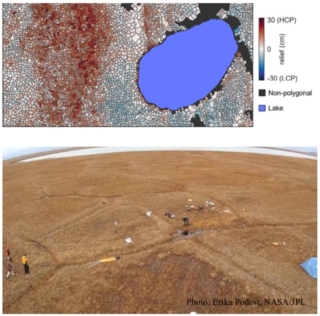
Small-scale changes in ground surface (known as microtopography) associated with ice wedge polygons drives pronounced, meter-scale spatial gradients in hydrologic and ecological processes on the tundra. However, high-resolution maps of polygonal geomorphology are rarely available, due to the complexity and subtlety of ice wedge polygon relief at landscape scales. Here we present a sub-meter-resolution map of more than 1 million discrete ice wedge polygons across an approximately 1,200 km2 landscape, delineated within a lidar-derived digital elevation model. The delineation procedure relies on a convolutional neural network paired with a set of common image-processing operations and permits explicit measurement of relative elevation at the center of each ice wedge polygon. The resulting map visualizes meter- to kilometer-scale spatial gradients in extensive polygonal geomorphology across a landscape with unprecedented detail. This high-resolution inventory of polygonal geomorphology, which is freely downloadable with the metadata and algorithms, provides rich spatial context for extrapolating observations of environmental processes across this landscape. The map also represents a comprehensive baseline data set for quantifying contemporary land surface deformation (i.e., thermokarst) at the survey area through future topographic surveys.
Why is this research important and why do the results matter?
- Ice wedge polygons are approximately 30 m in diameter, hydrologically disconnected, and are potential sites emitting methane and carbon dioxide (CO2).
- Automatically identifying these subtle landscape features is providing us the opportunity to quickly and accurately assess regional landscape status. The general shape of these features influences the types of carbon emissions (e.g., methane or CO2).
- These results are vital for understanding how landscapes in the Arctic tundra are changing or may change as the regional climate warms and how to incorporate the findings into regional models.

