Status and Trends of Texas Wetlands, 1950’s to 2000’s
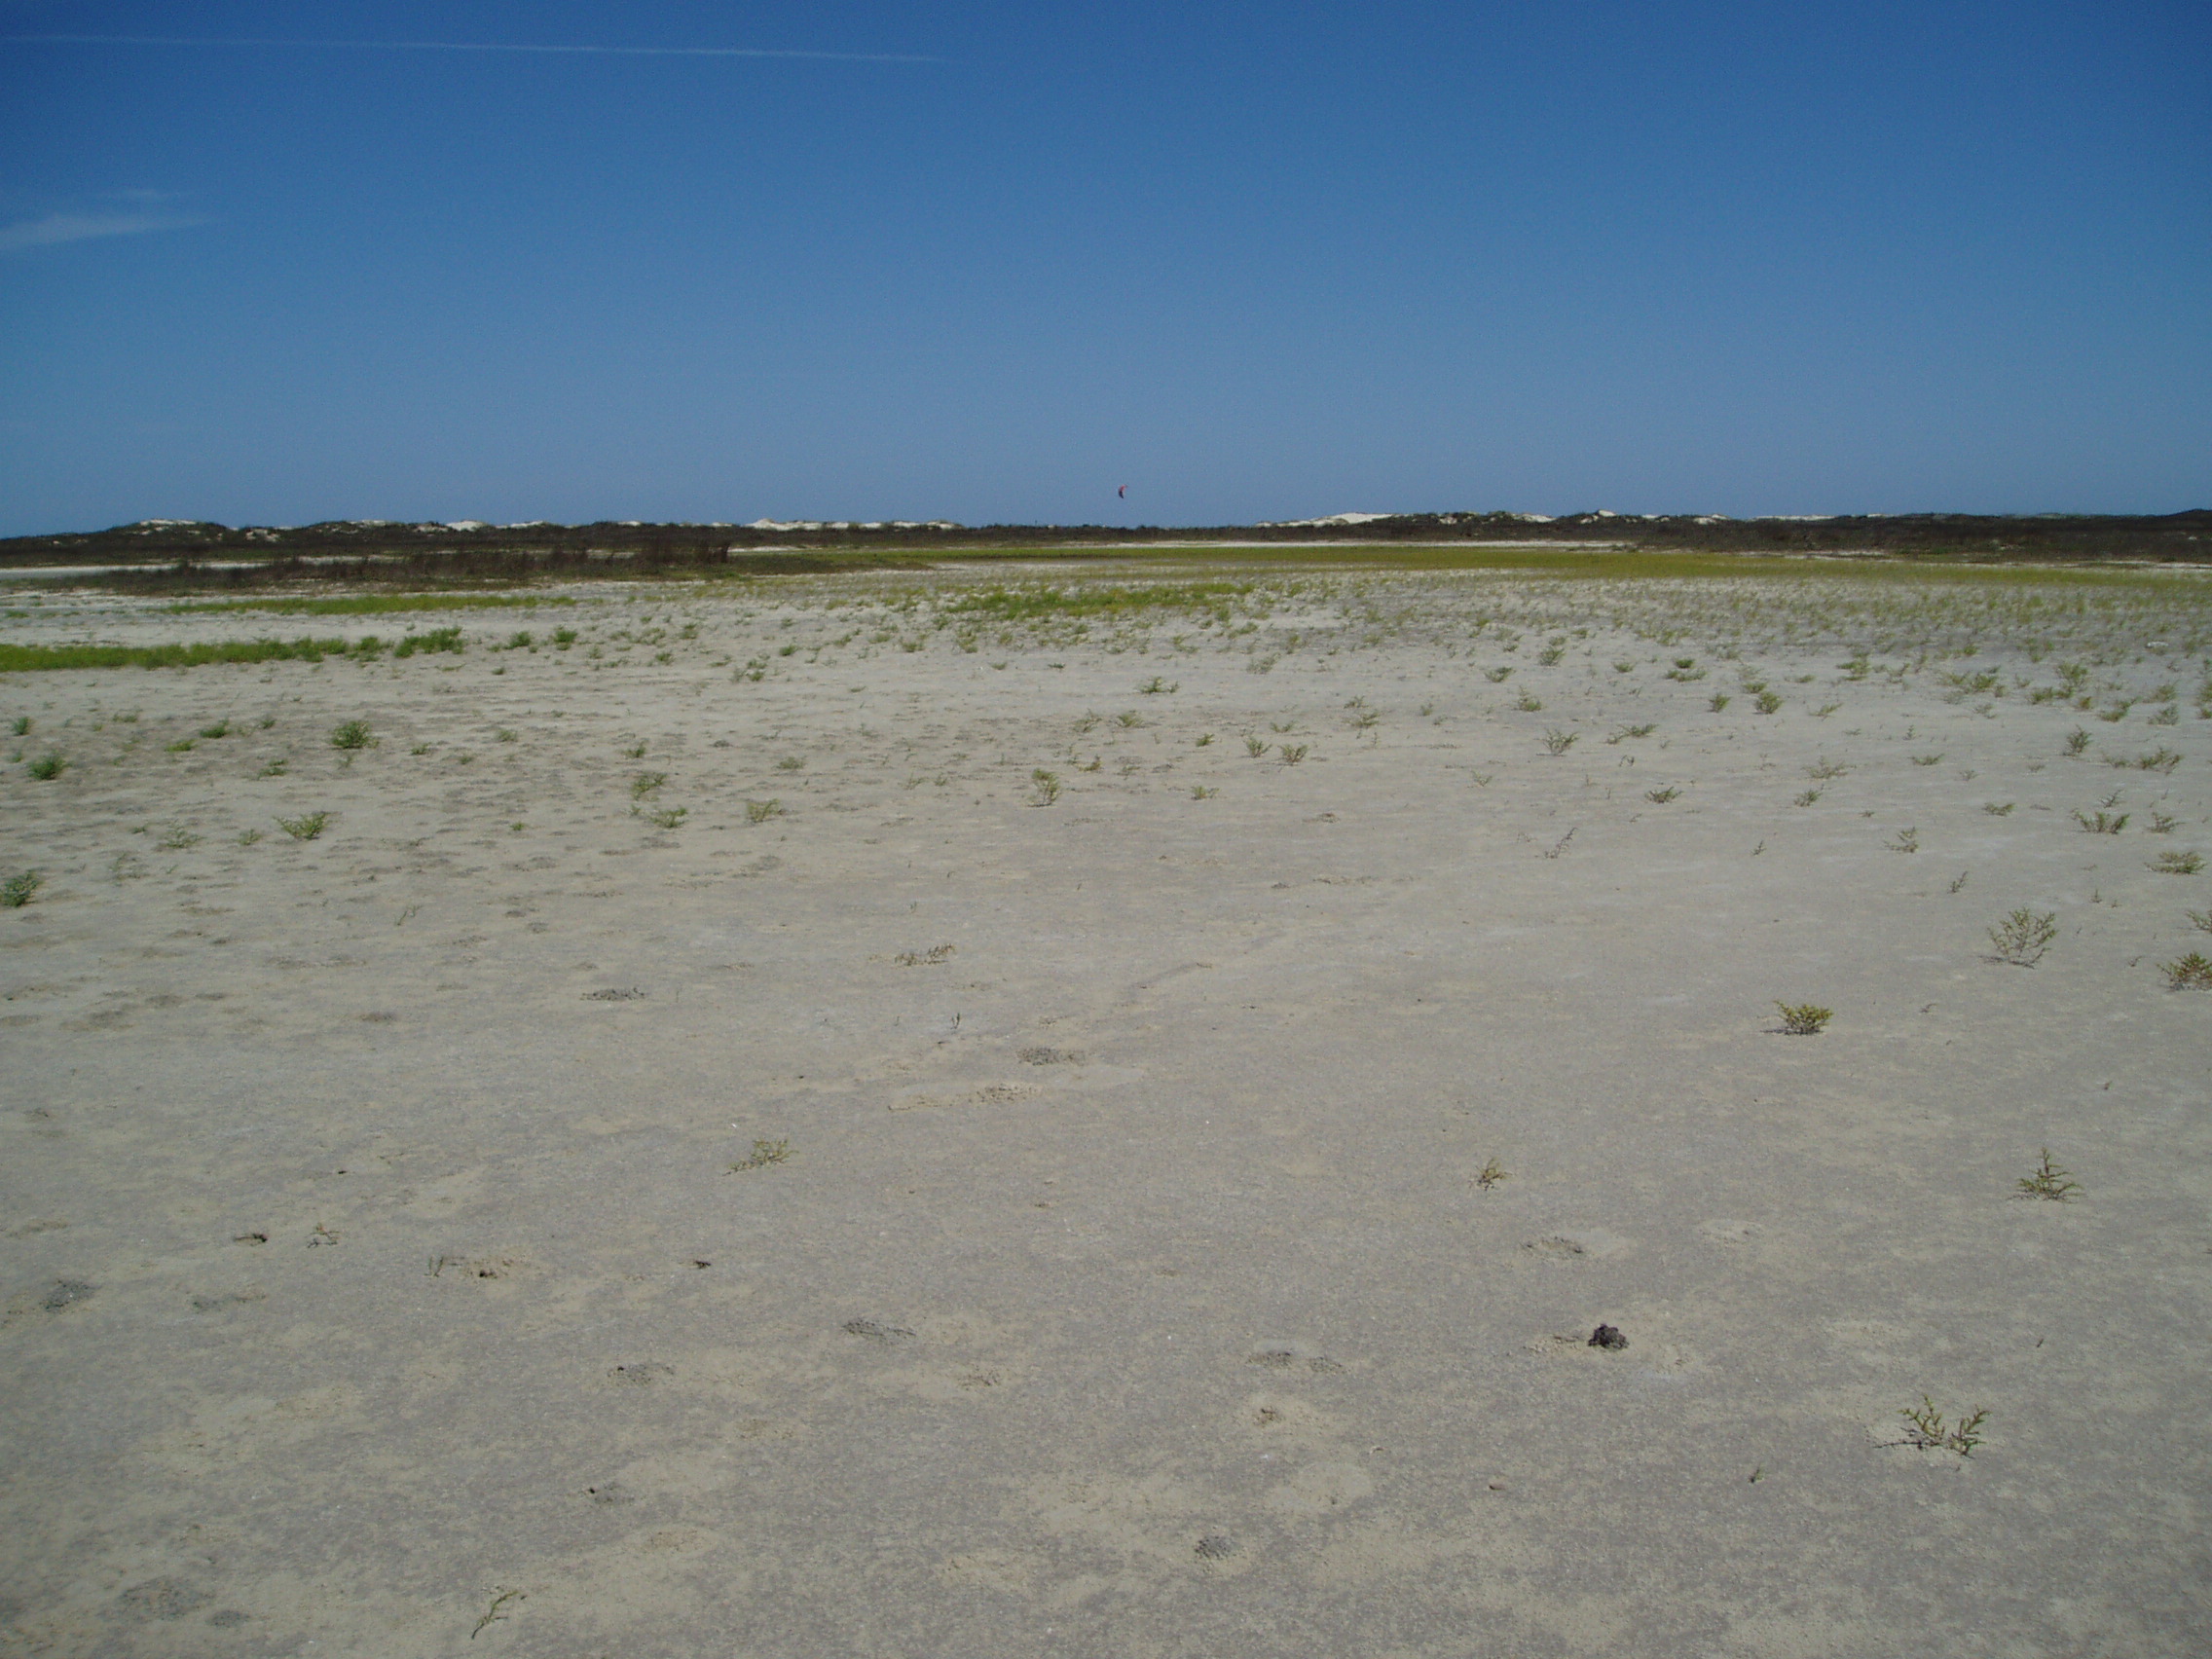
Wetland and aquatic habitats are essential components of estuarine and inland systems along the Texas coast. These valuable resources are highly productive biologically and chemically and are part of an ecosystem on which a variety of flora and fauna depend. Scientific investigations of wetland distribution and abundance through time are prerequisites to effective habitat management that ensures habitat protection and preservation, which directly promotes long-term biological productivity and public use.
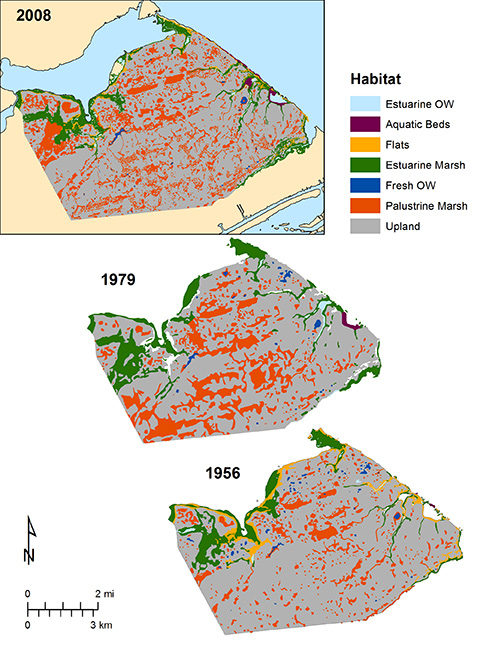
The Bureau of Economic Geology’s studies of status and trends is based on wetlands interpreted and mapped on recent and historical aerial photographs. Current distribution (status) of wetlands was determined using color infrared (CIR) photographs taken in the 2001-2008. Historical distribution was determined on the basis of 1950’s black-and-white and 1979 CIR photographs.
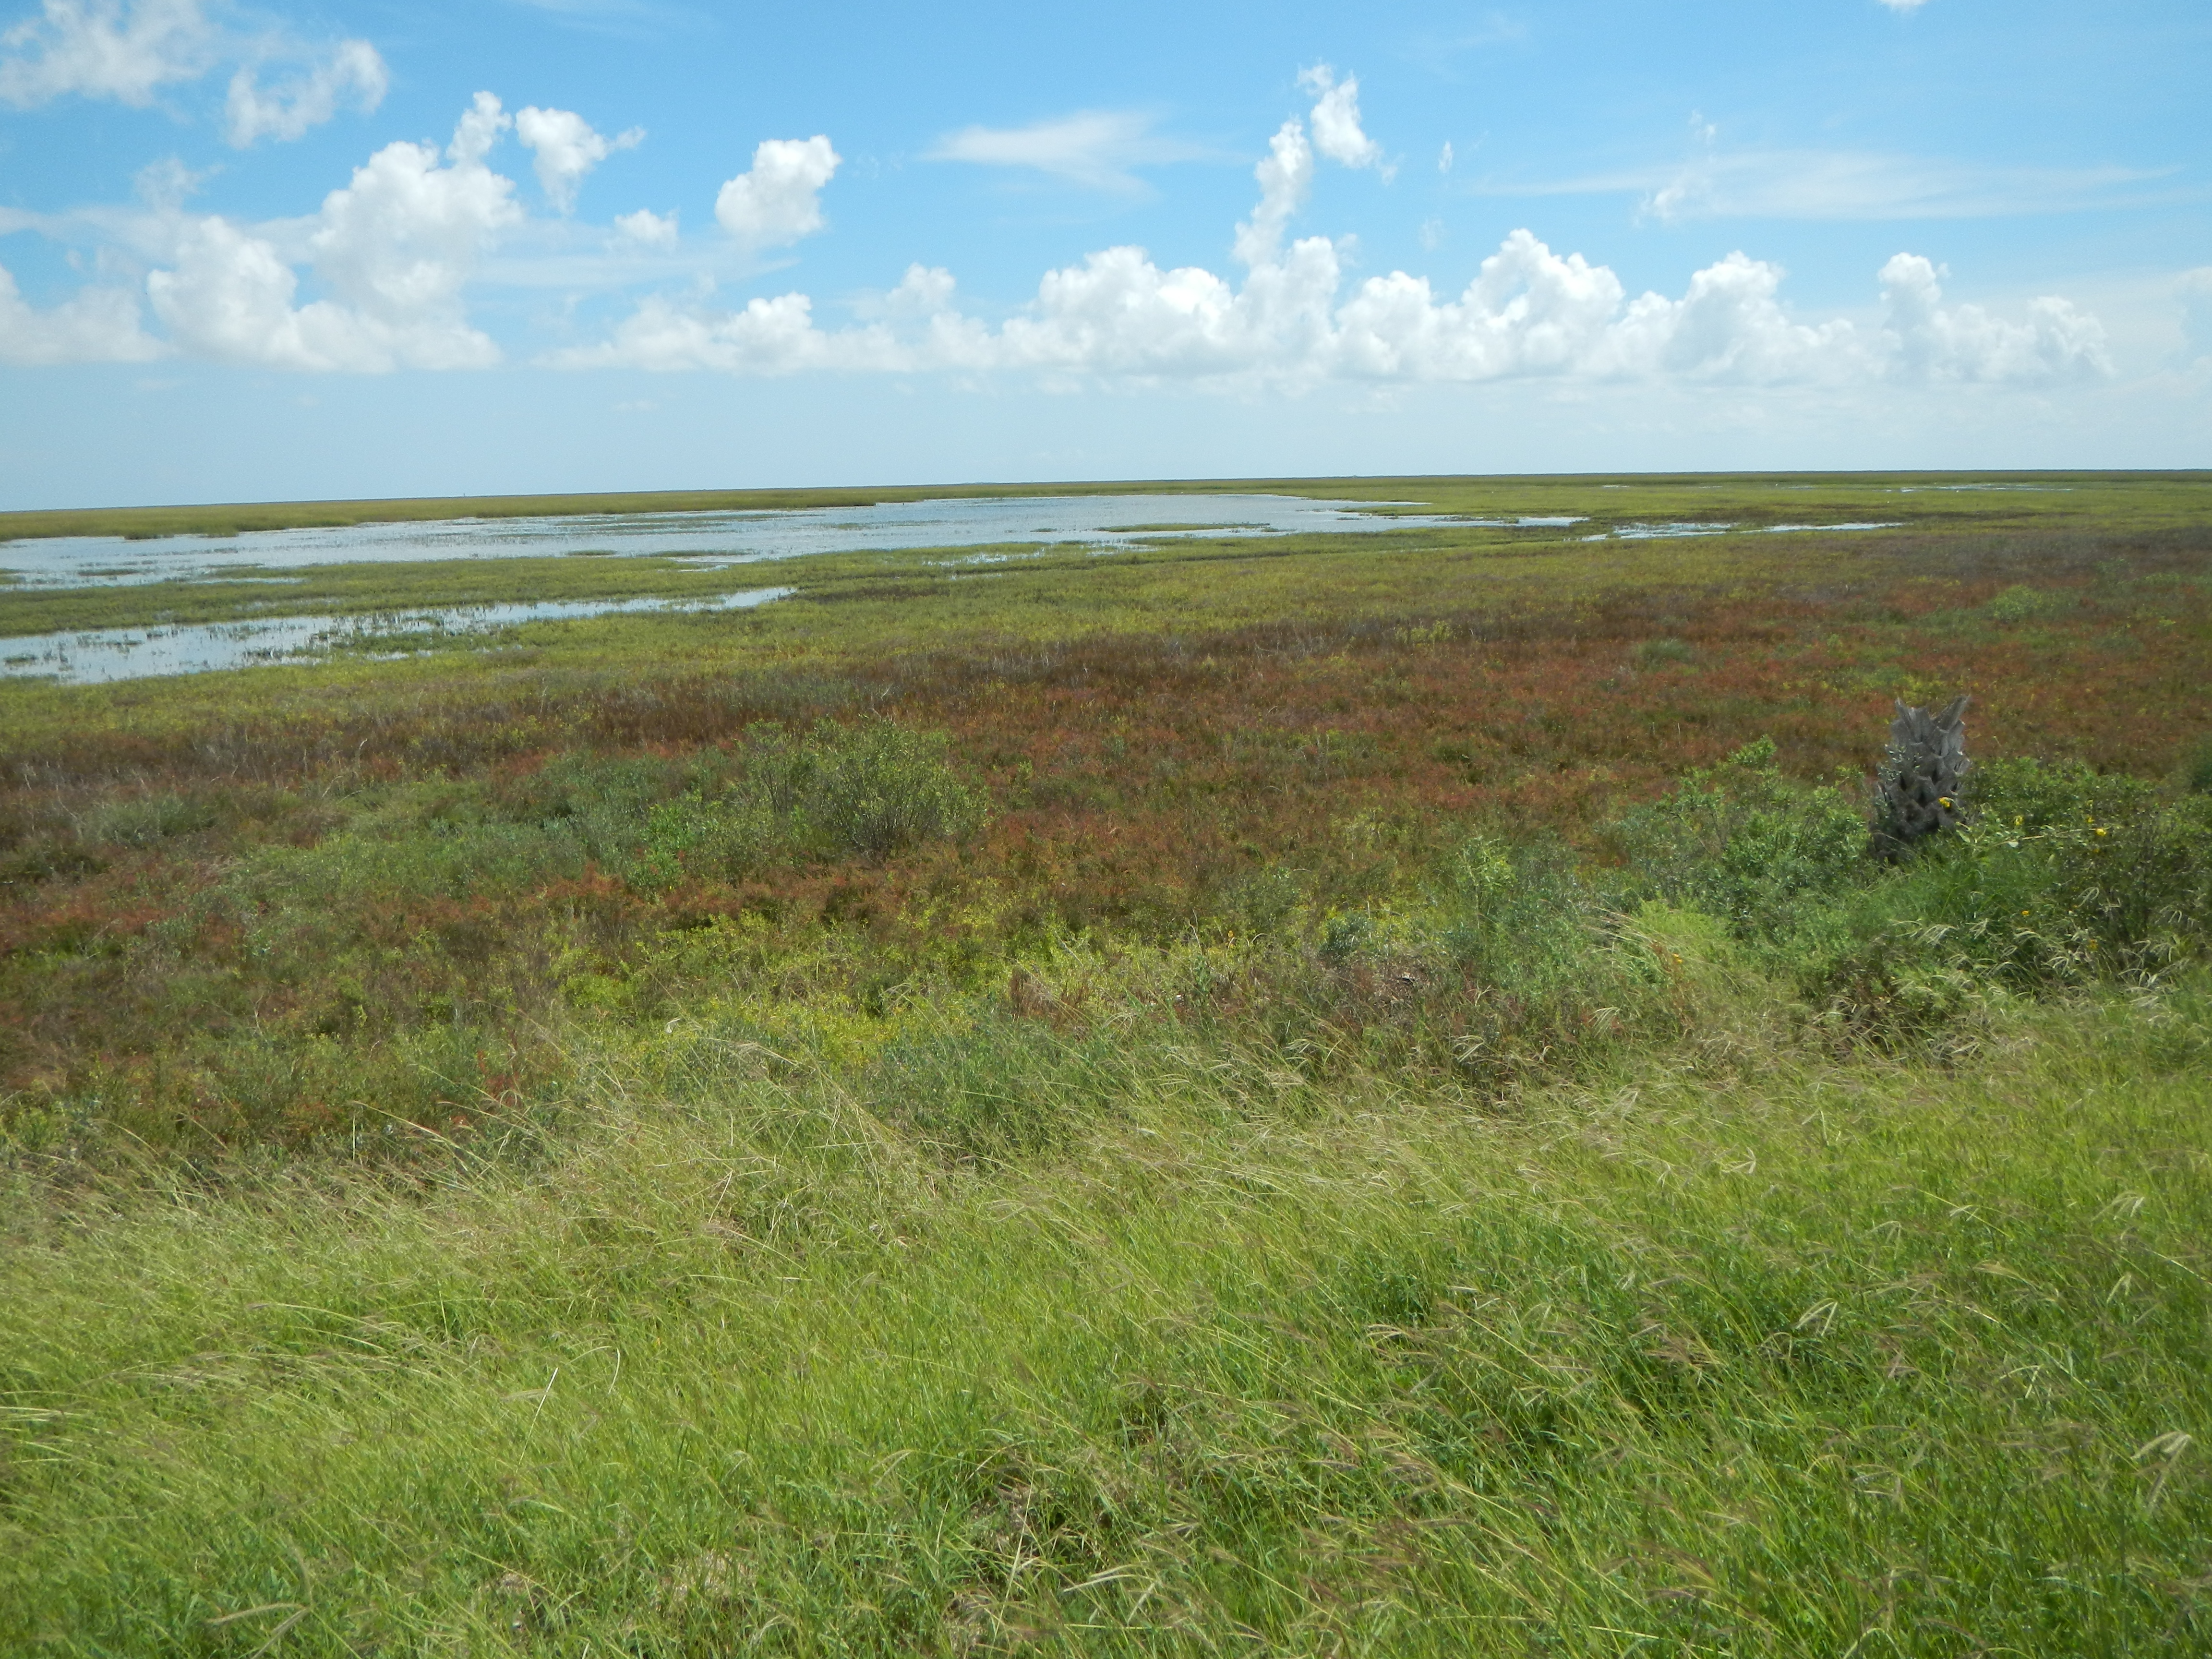
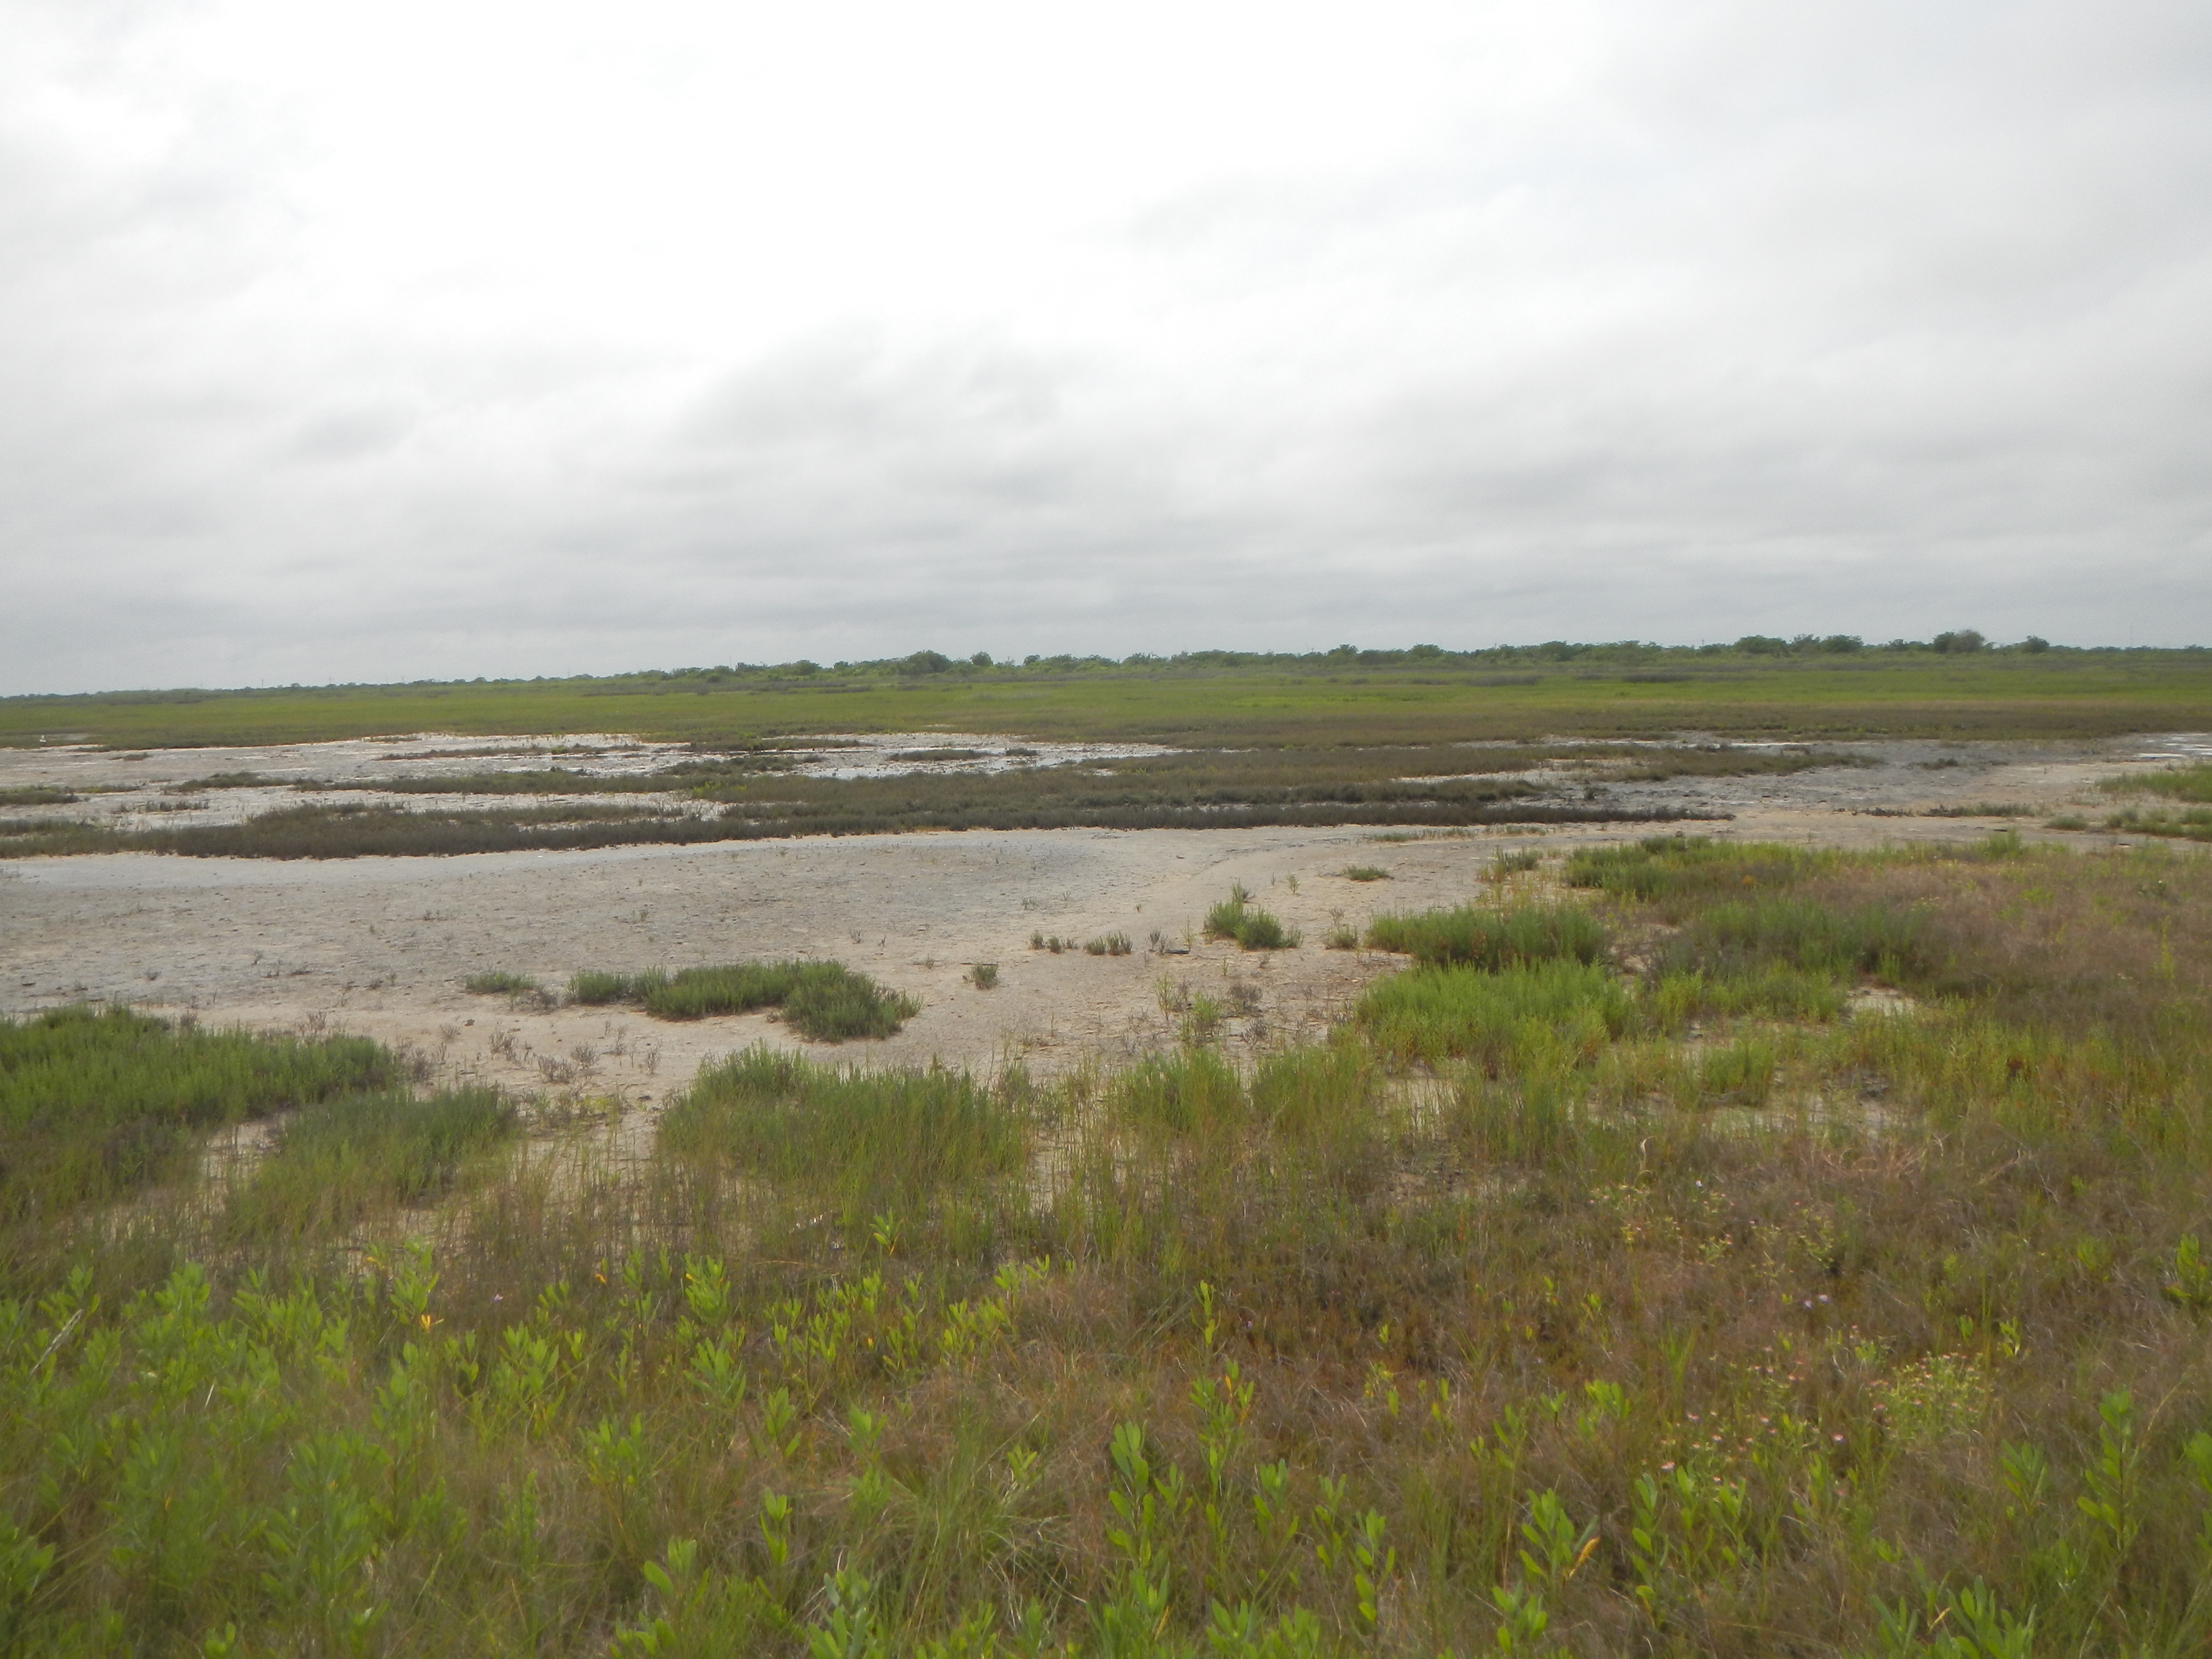
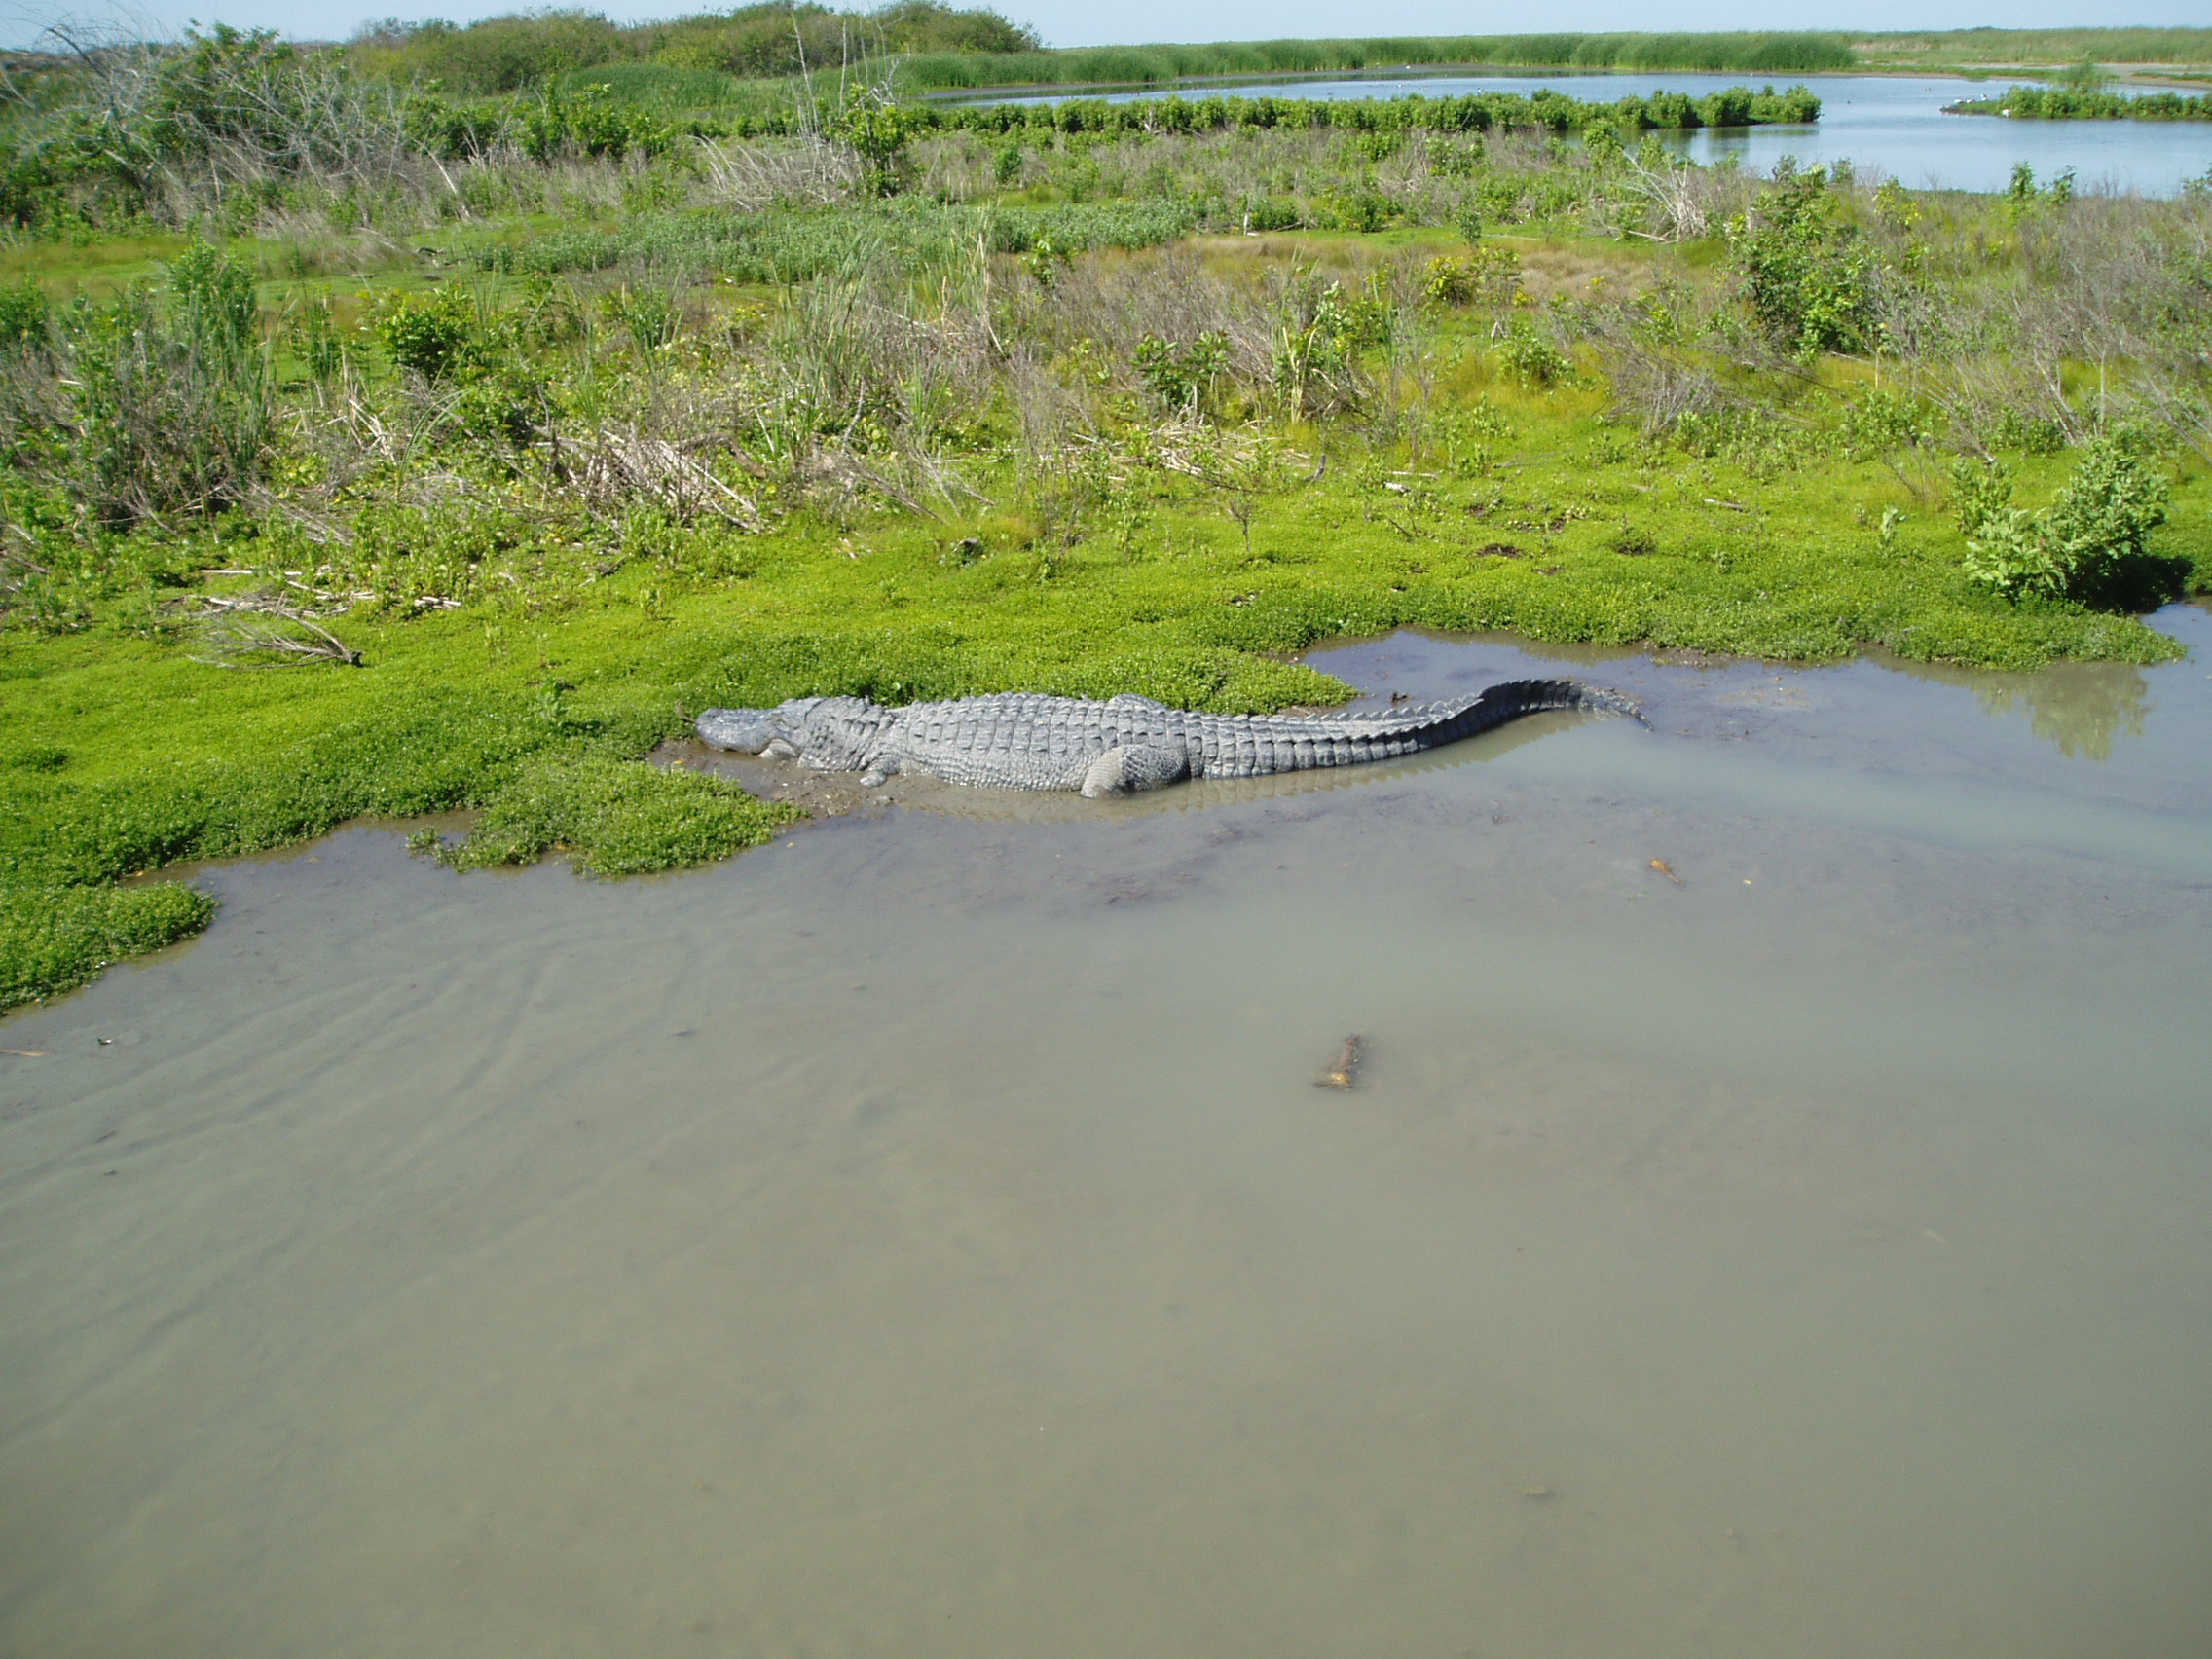
Wetland and aquatic habitats are essential components of estuarine and inland systems along the Texas coast. These valuable resources are highly productive biologically and chemically and are part of an ecosystem on which a variety of flora and fauna depend. Scientific investigations of wetland distribution and abundance through time are prerequisites to effective habitat management that ensures habitat protection and preservation, which directly promotes long-term biological productivity and public use.
The Bureau of Economic Geology’s studies of status and trends is based on wetlands interpreted and mapped on recent and historical aerial photographs. Current distribution (status) of wetlands was determined using color infrared (CIR) photographs taken in the 2001-2008. Historical distribution was determined on the basis of 1950’s black-and-white and 1979 CIR photographs.
Mapped wetlands for each period were digitized and entered into a geographic information system (GIS) for analysis. The historical GIS maps were obtained from the U.S. Fish and Wildlife Service (USFWS), who mapped the wetlands using methods established as part of the National Wetlands Inventory (NWI) program. Both the 1950’s- and 1979-series USFWS maps, which are in digital format, were partly revised for these projects to be more consistent with wetlands interpreted and delineated on the basis of the 2000’s photography.
Methods used to delineate current habitats differed from earlier methods. The 2000’s photographs were digital images with a pixel resolution of 1 m and registered to U.S. Geological Survey Digital Orthophoto Quadrangles (DOQ’s). Wetlands and aquatic habitats were mapped through interpretation and delineation of habitats on screen in a 1:5,000-scale GIS. Resulting current-status GIS maps were used to make direct comparisons with the historical GIS maps to determine habitat trends and probable causes of trends. Wetlands were mapped in accordance with Cowardin and others (1979), in which wetlands are classified by system (marine, estuarine, riverine, palustrine, lacustrine), subsystem (reflective of hydrologic conditions), and class (descriptive of vegetation and substrate). Maps for 1979 and the 2000’s were additionally classified by subclass (subdivisions of vegetated classes only), water regime, and special modifiers. This is the classification used by the USFWS in delineating wetlands as part of the NWI.
The Bureau’s Status and Trends reports and 2000’s status data can be downloaded for the geographical areas listed in the sidebar. Each page will have general information regarding the 2000’s habitat status and 1950’s–2000’s wetland trends for the study area. For detailed information regarding the Bureau’s Texas wetland Status and Trends program, please see the project reports.
Cowardin, L. M., Carter, V., Golet, F. C., and LaRoe , E. T., 1979, Classification of wetlands and deepwater habitats of the United States: Washington, D.C., United States Department of the Interior, Fish and Wildlife Service, 131 p.
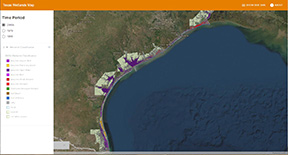
Interactive Wetlands Map
View mapped habitats on the Texas coast from the 1950’s, 1979, and 2000’s using the Interactive Wetlands Map Viewer. The wetland classification definitions in this application are based on the US Fish and Wildlife Service’s National Wetlands Inventory. The wetlands were mapped on the basis of the vegetation, hydrology, and geography at the time imagery was acquired. Ground features may have changed since the date of imagery acquisition. Data for this application were taken from the Bureau’s coastwide studies of the status and trends of wetlands and aquatic habitats (2002–2012). See the links in the sidebar for information regarding project areas and to download reports and data.
Educational Resource
An educational activity was developed that uses wetland status data from two areas in the Texas coastal bend. Powderhorn Ranch is located on the southwestern shoreline of Matagorda Bay in Calhoun County. Mustang Island State Park is located on a barrier island near Corpus Christi, Texas in Nueces County. Students examine these properties owned by Texas Parks and Wildlife Department to answer questions about trends in habitat change through time (1950’s, 1970s, and 2000s). Wetland Status and Trend Activity
Acknowledgements
This project was funded by a Texas Coastal Management Program grant approved by the Texas Land Commissioner pursuant to National Oceanic and Atmospheric Administration Award No. NA18NOS4190153. Additional funds from the State of Texas were provided through the State of Texas Advanced Oil and Gas Resource Recovery (STARR) program. Publication authorized by the Director, Bureau of Economic Geology.
For more information, please contact:
Tiffany Caudle
512-475-9572
tiffany.caudle@beg.utexas.edu