STATUS AND TRENDS OF INLAND WETLAND AND AQUATIC HABITATS
Download Report
Download Freeport-Sargent Data
Download South Padre Island Data
This report presents results of two investigations designed to determine current status and historical trends of wetlands and associated aquatic habitats along (1) the Texas Gulf coast from Christmas Bay southwestward to East Matagorda Bay, an area that includes the Brazos River delta near Freeport, and (2) South Padre Island and Brazos Island, the barrier island system that extends to the Rio Grande south of Padre Island National Seashore. The northern study area is within Brazoria and Matagorda Counties and the southern study area is within Cameron and Willacy Counties.
The two study areas are very different. The area near Freeport is part of a delta plain without natural barrier islands. Islands that front this part of the coast were created by the Gulf Intracoastal Waterway (GIWW) that was dredged across this mainland area to connect the Galveston Bay system with the Matagorda Bay system. Included in this area is the San Bernard National Wildlife Refuge (SBNWR). Along this stretch of coast, the Brazos and San Bernard Rivers discharge into the Gulf of Mexico. The Brazos and San Bernard Rivers cross the study area and discharge southwest of Freeport into the Gulf of Mexico. In 1929, the lower reach of the Brazos River was diverted so that the mouth of the river now discharges about 10 km down the coast (southwest) from its original location near Surfside. The “abandoned” part of the channel has been jettied and dredged to create the Freeport Ship Channel. At the diverted mouth of the Brazos River, a new delta has formed consisting of numerous beach ridges and interlying swales that are the sites of marshes and ponds. Except for progradation of this delta, historically high rates of erosion have characterized this part of the Texas coast, which is part of the relict deltaic headland of the Colorado and Brazos Rivers. The high rates of erosion have threatened to intersect the GIWW in one area, requiring construction of a seawall to protect the waterway.
South Padre and Brazos Islands, in the South Texas study area, are barrier islands that separate the Gulf of Mexico from Laguna Madre and South Bay, respectively. These barriers are characterized by broad beaches, vegetation stabilized dunes, active dune fields, expansive wind-tidal flats, hurricane wash-over channels, brackish- and salt-water ponds and marshes, and black mangrove communities. Included in this study area are South Bay and the surrounding area that is located between the lower end of the Brownsville Ship Channel and the Rio Grande.
Freeport to East Matagorda Bay
Status, 2002
Major habitats in the estuarine and palustrine system include salt, brackish, and fresh marshes, tidal flats, oyster reefs, aquatic beds, and Gulf beaches. Estuarine open water is also an important component of the salt and brackish marsh complex. The primary habitats mapped in the marine system are (1) the Gulf beach, which consists of the topographically lower fore beach and a higher, less frequently flooded backbeach, and (2) a belt of marine water that fringes the shoreline and extends out into the Gulf about 1 km marking the seaward boundary of the study area.
In 2002, wetland and aquatic habitats (excluding open water) were dominated by estuarine marshes, with a total area of about 8,320 ha (20,542 acres), followed by palustrine marshes totaling 1,330 ha (3,284 acres) These marshes make up 45% of the Freeport–East Matagorda Bay study area. Other major components of the study area are oyster reefs, open water, and uplands.
Trends
From the 1950’s to 2002 within the Freeport to East Matagorda Bay study area, there were losses and gains in most habitats. Analyses of spatial and temporal changes show that there was a net gain in estuarine marshes from the 1950’s to 2002 (Table 1; Fig. 1 & 2). The total area of marshes increased from 7,727 ha (19,086 acres) in the 1950’s to 8,319 ha (20,548 acres) in 1979, where it remained in 2002 (). This increase amounted to 592 ha (1,462 acres) from the 1950’s through 2002. During the same time, there was a systematic decrease in tidal flats (E2FL or E2US). The area of flats declined from 899 ha (2,221 acres) in the 1950’s to 653 ha (1,613 acres) in 1979 to 363 ha (897 acres) in 2002. These changes reflect losses of 246 ha (608 acres) and 290 ha (716 acres) for each period, respectively. Palustrine marshes (PEM) increased in area by 623 ha (1,540 acres) from the 1950’s through 1979 and by 443 ha (1,094 acres) from 1979 through 2002. Estuarine reefs (E1 and E2RF2) are oyster reefs. The mapped area of reefs increased from the 1950’s to 1979/2002 by approximately 145 ha (358 acres). Reefs can be obscured by turbid water, however, and total distribution as interpreted on aerial photography is approximate. The area of estuarine open water increased slightly from the earlier years to 2002. Gulf open water in the study area also increased from the 1950’s to 1979 and 2002. The amount of mapped uplands in the study area decreased from the 1950’s to later years.
|
Habitat |
1950's |
1979 |
2002 |
|||
|
|
(ha) |
(acres) |
(ha) |
(acres) |
(ha) |
(acres) |
|
Estuarine marsh |
7,727 |
19,086 |
8,319 |
20,548 |
8,319 |
20,548 |
|
Tidal flat |
899 |
2,220 |
653 |
1,613 |
363 |
897 |
|
Palustrine marsh |
264 |
651 |
887 |
2,190 |
1,330 |
3,285 |
|
Gulf beach |
460 |
1,135 |
310 |
766 |
227 |
561 |
|
Oyster reefs |
121 |
299 |
265 |
655 |
267 |
659 |
|
Estuarine open water |
2,472 |
6,106 |
2,408 |
5,948 |
2,591 |
6,400 |
|
Gulf open water |
3,224 |
7,962 |
3,629 |
8,964 |
3,701 |
9,141 |
|
Upland |
6,336 |
15,650 |
4,881 |
12,056 |
3,954 |
9,766 |
Table 1. Total area of major habitats in the Freeport–East Matagorda Bay study area in the1950’s, 1979, and 2002.
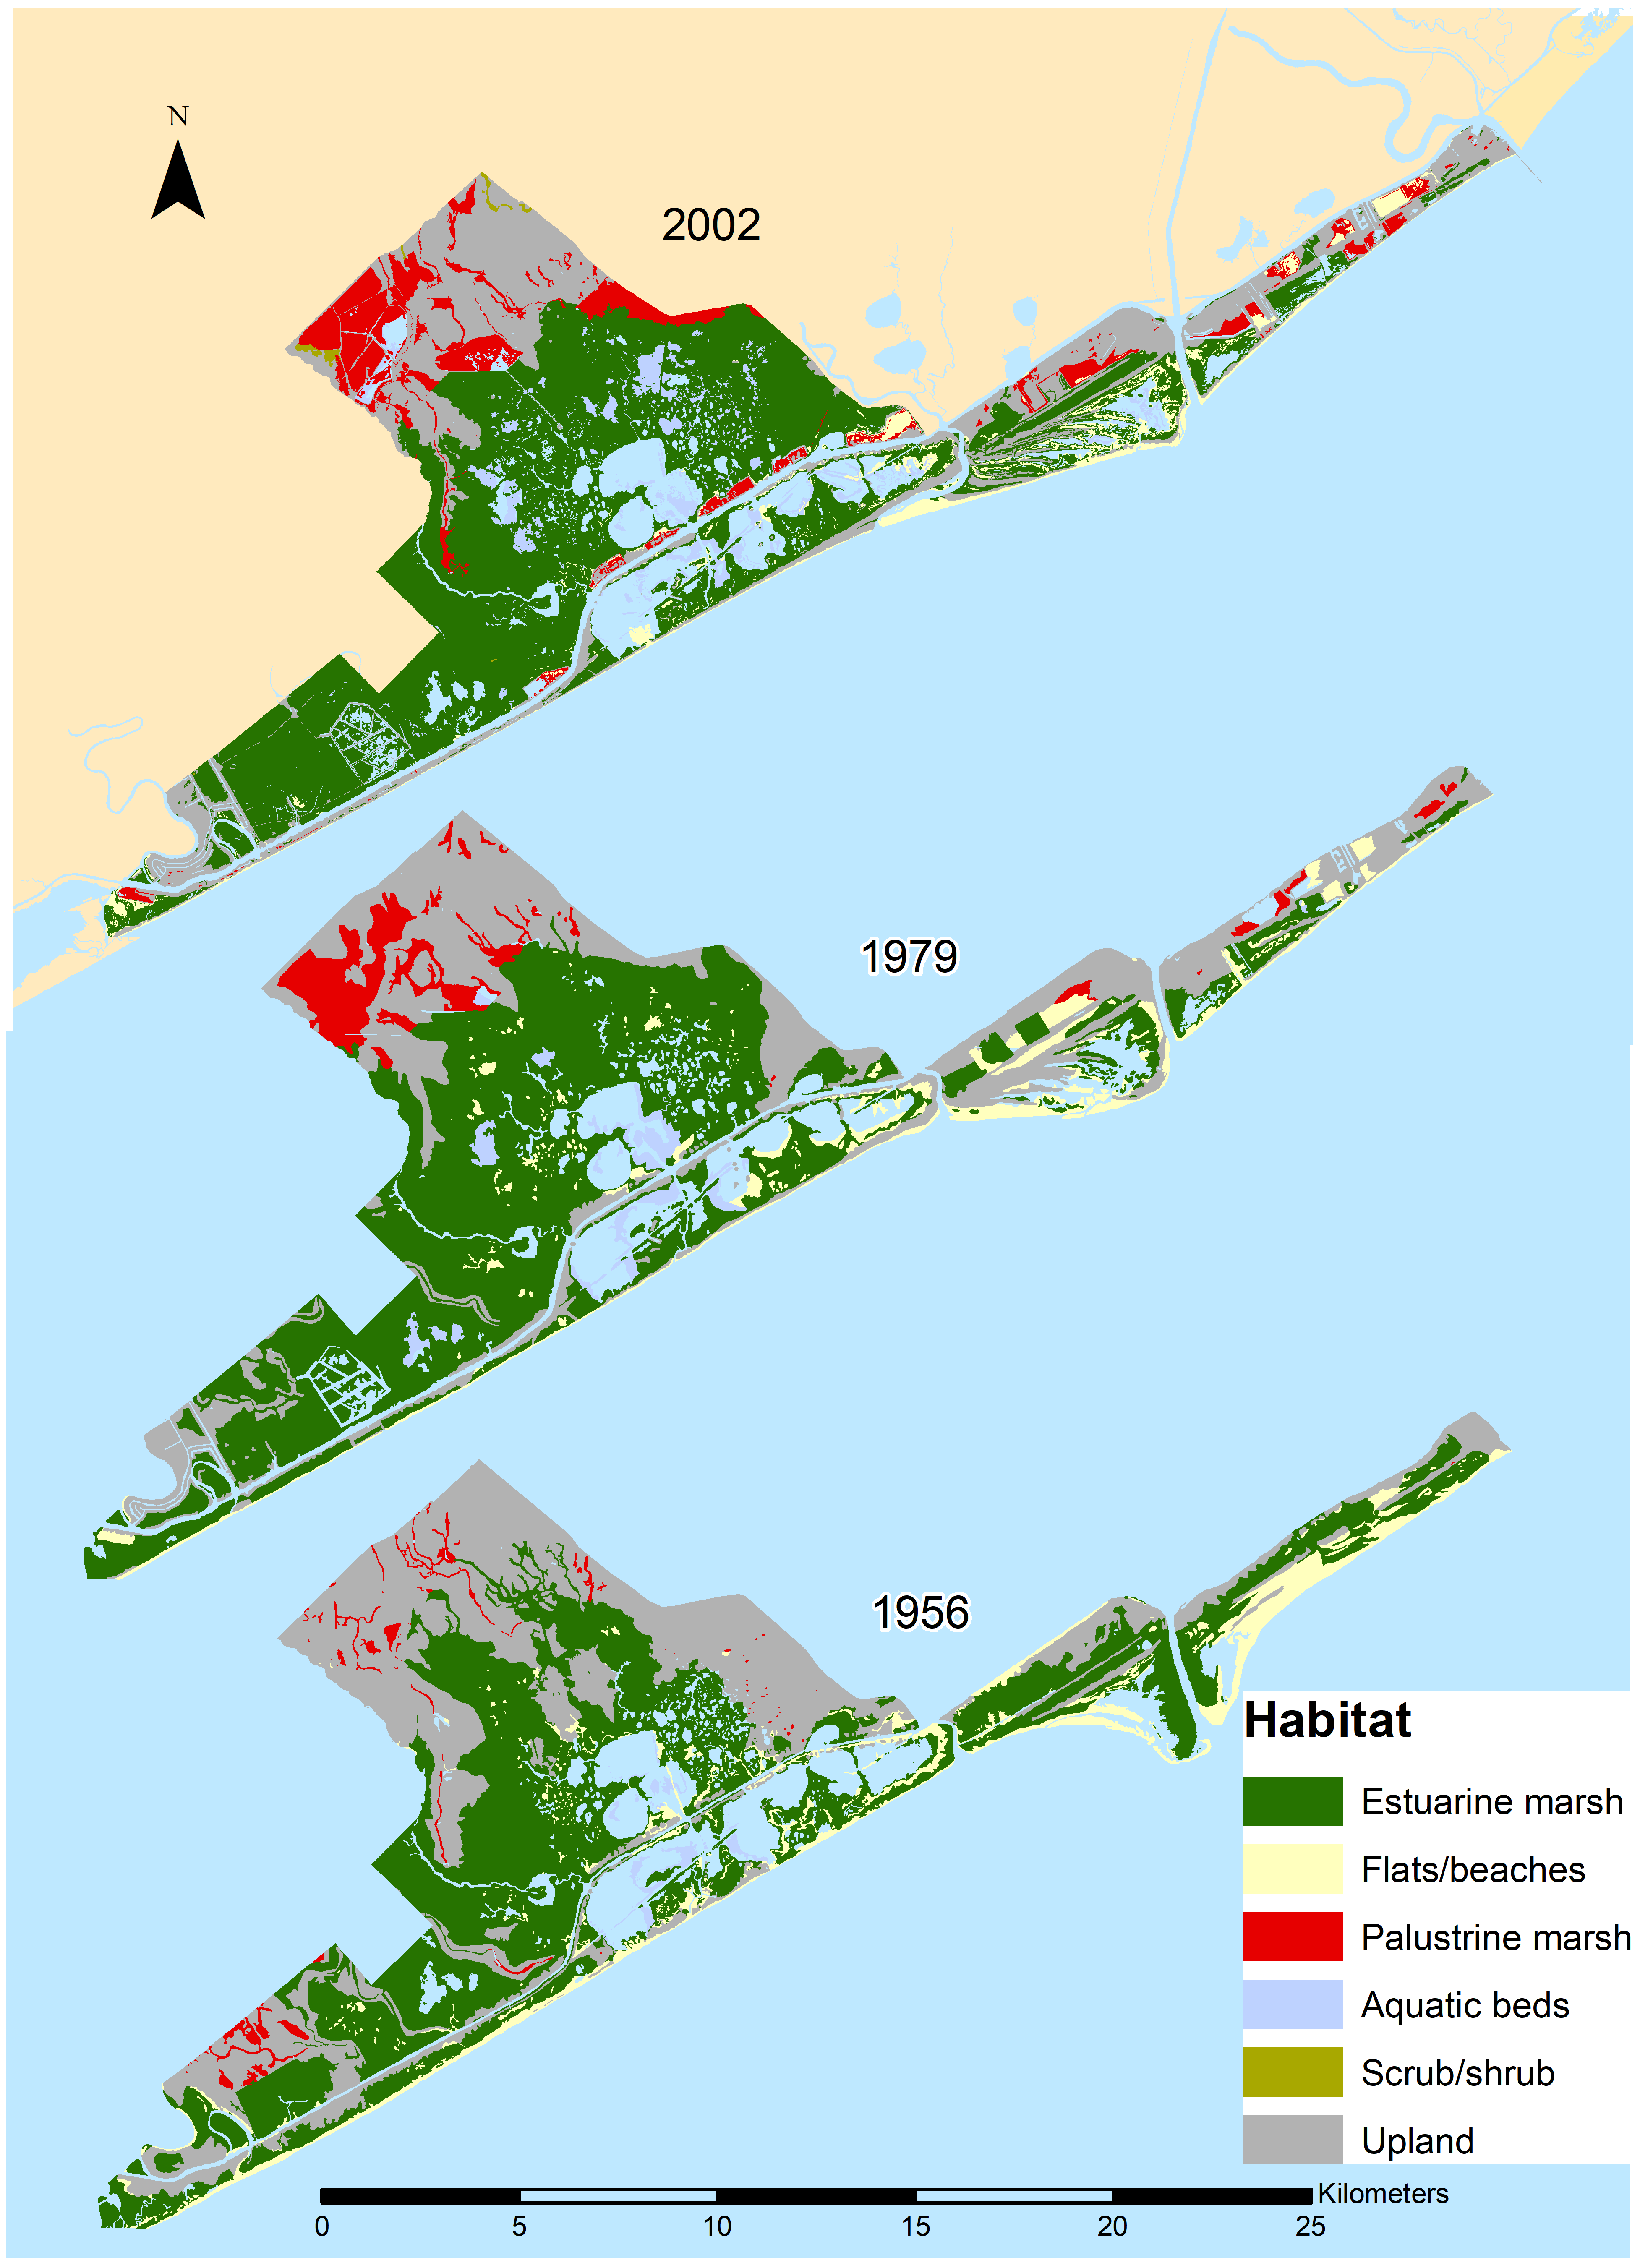
Figure 1. Map showing distribution of major wetland and aquatic habitats in 2002, 1979, and the 1950’s in study area.
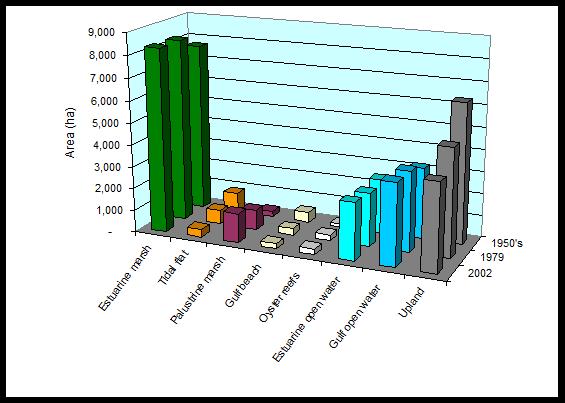
Figure 2. Area (ha) of selected habitats in the Freeport–East Matagorda Bay study area from the 1950’s to 2002. Gulf open water that was included in the study area is composed of a fringe of water approximately 700 m wide (in 2002) and parallel to the Gulf beach. As the Gulf beach eroded through time, Gulf open water increased in area, but most of the increase in area was caused by a large misregistration in the 1950’s data set.
South Padre Island
Status, 2002
In 2002, wetland, aquatic, and upland habitats covered 46,289 ha (114,382 acres) within the South Padre Island study area. This area includes buffer zones of open water roughly 1 km wide that parallels the shoreline in Laguna Madre and the shoreline in the Gulf. Approximately 6,885 ha (17,013 acres) within the study area was classified as uplands. Of the four wetland systems mapped, the estuarine system is the largest. The largest habitats are the wind-tidal and algal-flat classes, together covering 21,666 ha (53,538 acres). Emergent vegetated wetlands (E2EM, E2SS, PEM) cover 768 ha (1,898 acres), about 80% of which is estuarine marsh. Another important habitat class is seagrass (E1AB3), which in the study area has an area of almost 4,000 ha (9,884 acres). Seagrass beds extend beyond the study area into Laguna Madre.
Trends
Analysis of trends in wetlands and aquatic habitats from the 1950’s through 2002 shows that wind-tidal/algal flats decreased from the 1950’s to 1979, and increased slightly from 1979 to 2002 (Table 2; Fig. 3 & 4). Wind-tidal flats are, by far, the most extensive habitat. The broader distribution in the 1950’s may be in part related to the mid-1950’s drought when estuarine open water was apparently at lower levels than in 1979 and 2002. Accordingly, more flats would be exposed at that time. Seagrasses appeared to decline from the 1950’s to 1979 and then increase to a higher level by 2002. Much of the decline in 1979 may have been an apparent and not real decline, as a result of high-water levels and turbidities, which can obscure submerged seagrasses on aerial photographs. The total areas of estuarine marshes were relatively stable, not changing more than about 30 ha (74 acres) between periods. Their spatial distribution, however, was not necessarily the same. Estuarine scrub/shrub wetlands (primarily mangroves) showed an increase in time. Mangroves, however, could not be adequately mapped separately on the black-and-white 1950’s photographs and were included with marshes in most areas. There was a real increase in mangrove distribution from 1979 to 2002, which is explained in the later discussion of subarea trends. Palustrine habitats had their largest distribution of 99 ha (245 acres) in 1979. Still, the difference in total area was relatively small in the 1950’s (71 ha; 175 acres) and 2002 (87 ha; 215 acres). The large difference in area of estuarine open water, which covered an area almost twice as large in 1979 as in the 1950’s and 2002 (Table II), appears to be due to higher water levels “captured” in the 1979 aerial photographs that flooded the tidal flats. This was a coast wide phenomenon.
|
Habitats |
1950's |
1979 |
|
|||
|
|
(ha) |
(acres) |
(ha) |
(acres) |
(ha) |
(acres) |
|
Tidal/algal flat |
23,800 |
58,786 |
20,698 |
51,124 |
21,666 |
53,515 |
|
Seagrass |
3,343 |
8,257 |
1,998 |
4,935 |
4,033 |
9,962 |
|
Estuarine marsh |
584 |
1,442 |
612 |
1,512 |
604 |
1,492 |
|
Mangrove |
12 |
30 |
70 |
173 |
93 |
230 |
|
Palustrine marsh/US/UB |
71 |
175 |
99 |
245 |
87 |
215 |
|
Gulf beach |
393 |
971 |
503 |
1,242 |
600 |
1,482 |
|
Estuarine open water |
4,812 |
11,886 |
8,133 |
20,089 |
4,487 |
11,083 |
|
Marine open water |
6,656 |
16,440 |
7,603 |
18,779 |
7,709 |
19,041 |
|
Upland |
6,475 |
15,993 |
6,468 |
15,976 |
6,884 |
17,003 |
Table 2. Areal distribution of selected habitats, 1950’s to 2002, in the South Padre Island study area. Palustrine flat (US) and water (UB) are combined with Palustrine marsh in the table.
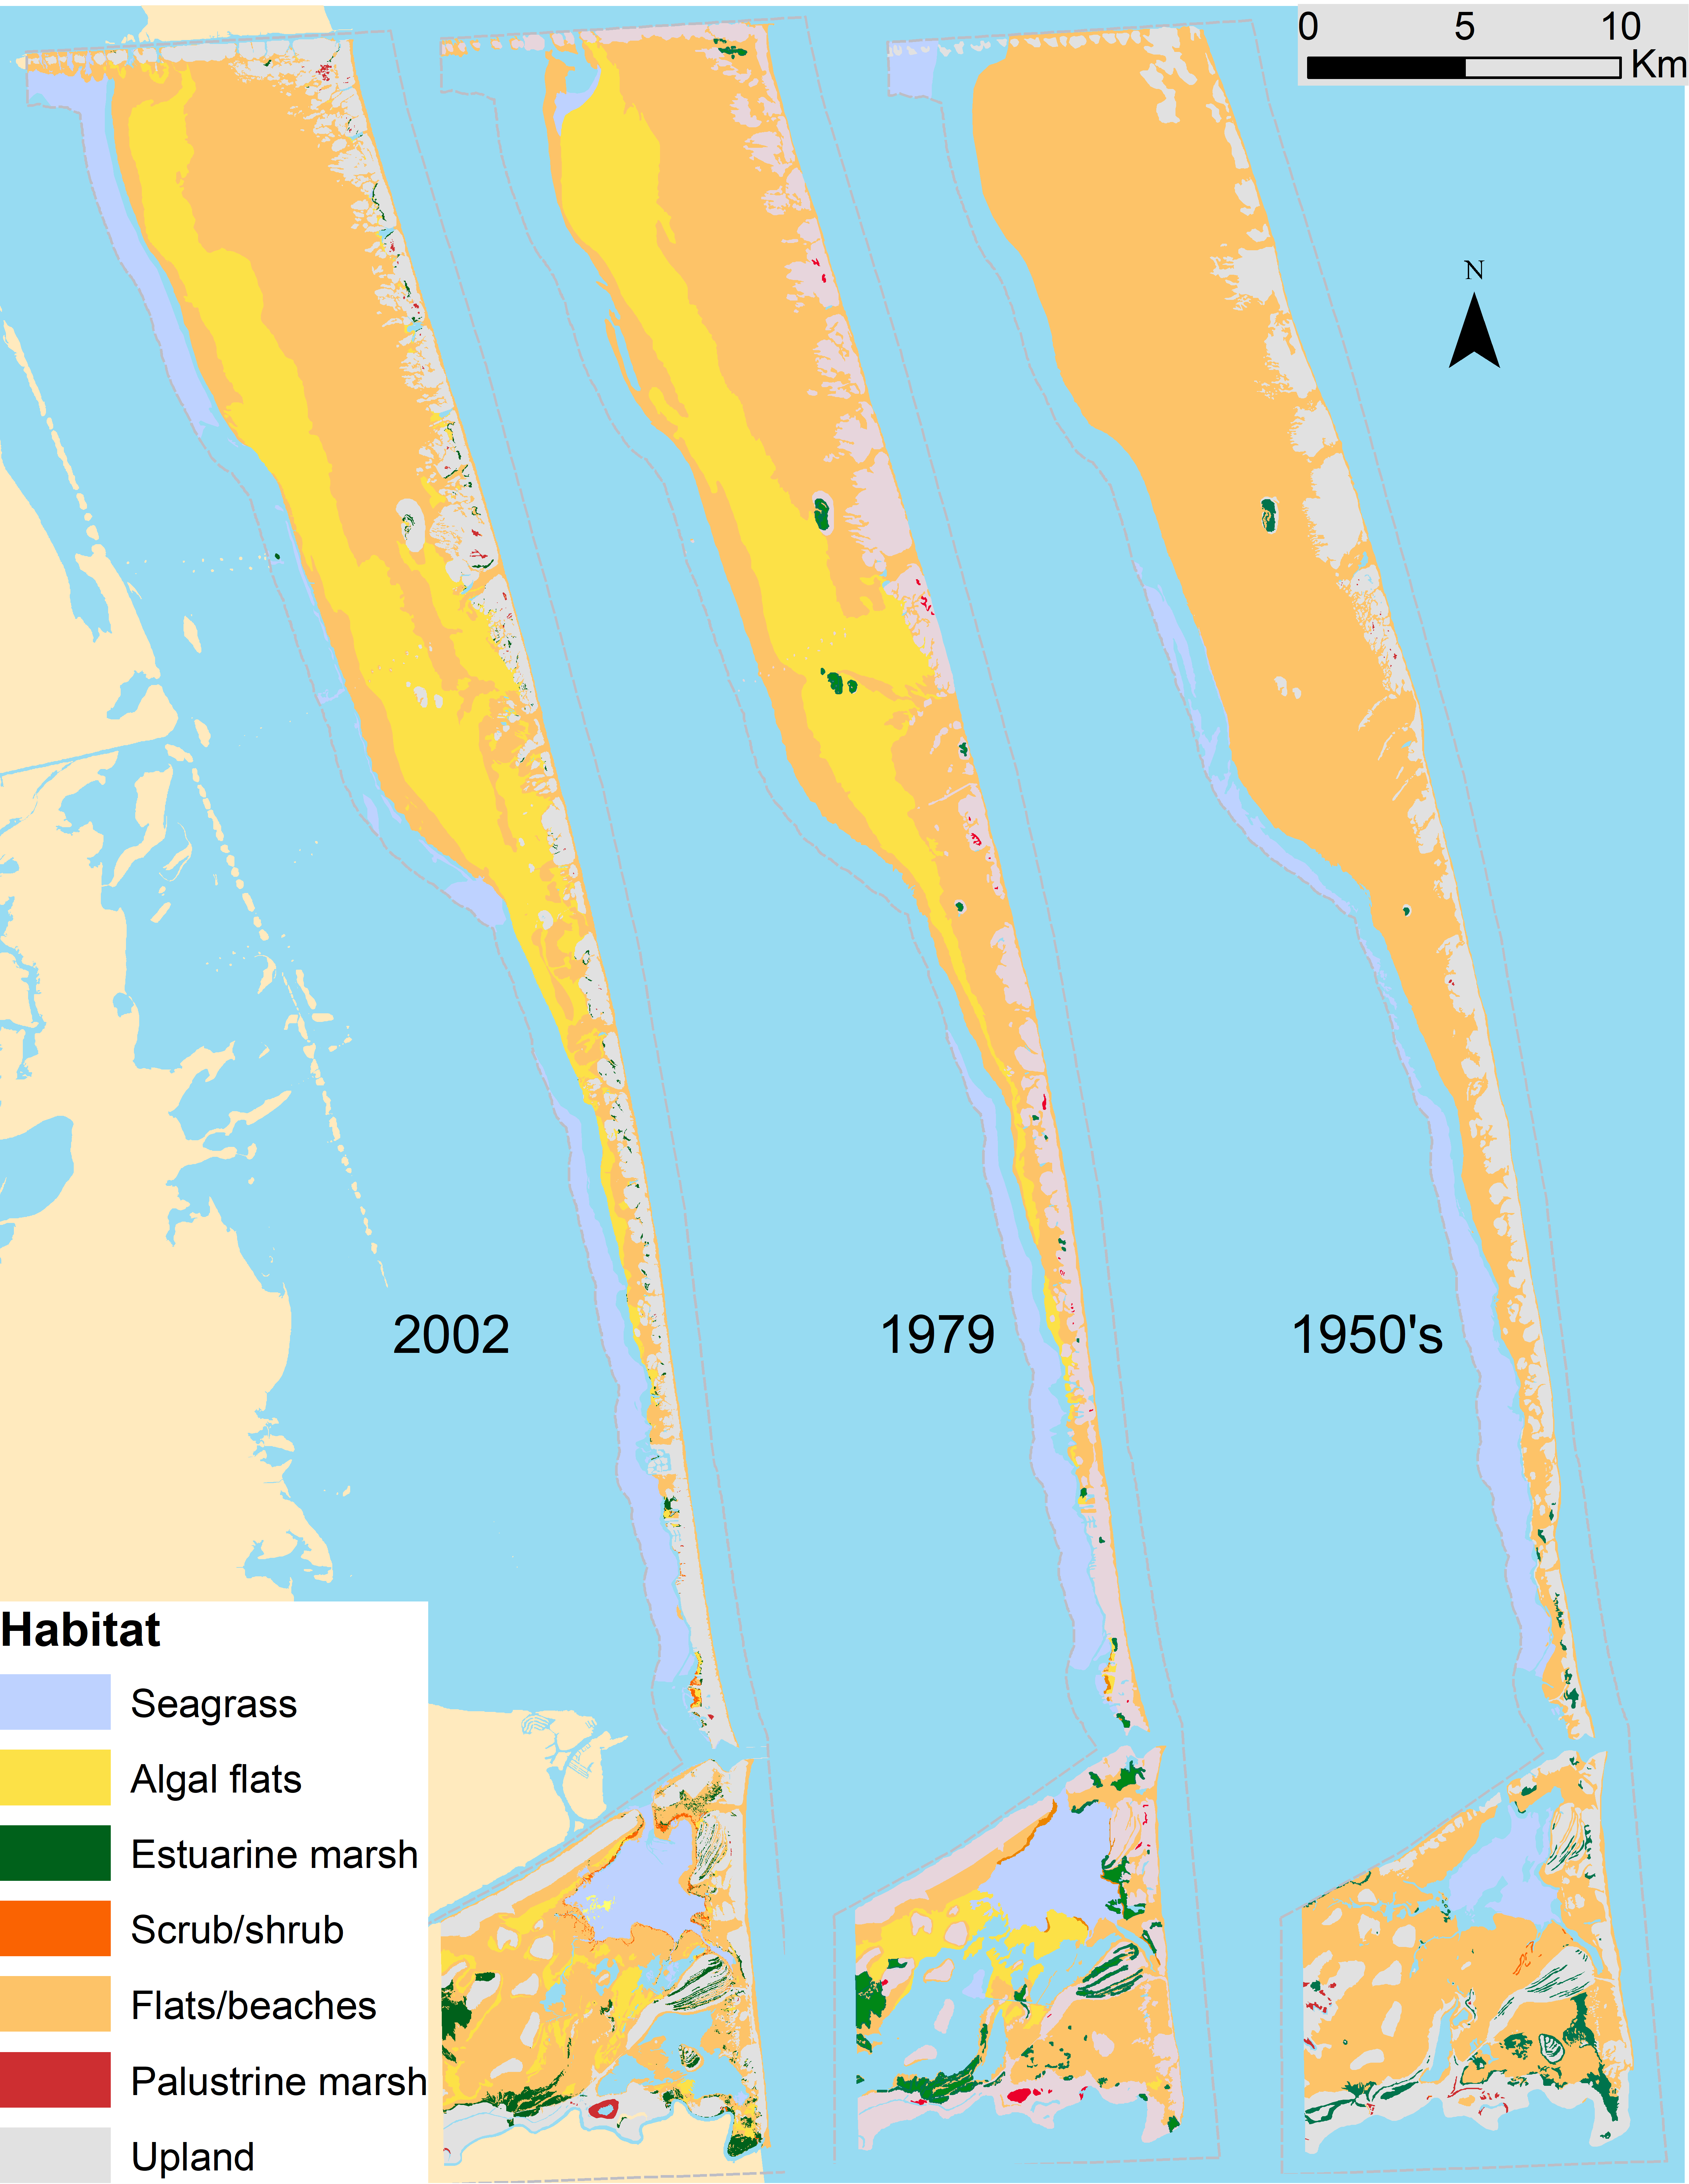
Figure 3. Maps showing distribution of major wetland and aquatic habitats in 2002, 1979, and the 1950’s in the South Padre Island study area. Algal flats shown only in 2002 and 1979. Seagrass shown only within map area in Laguna Madre.
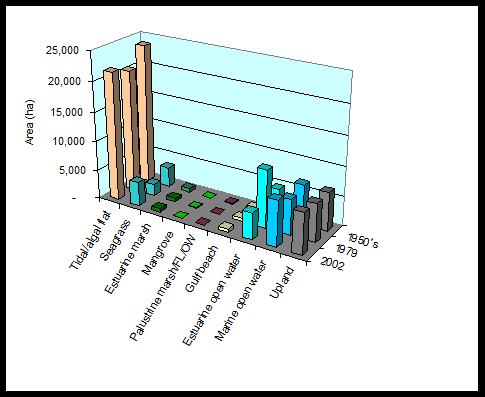
Figure 4. Areal extent of selected habitats from the 1950’s to 2002 in the South Padre Island study area.