
The Water-Energy Nexus: Power and Water
Power generation using water: studies related to water use in electricity generation.
CURRENT PROJECTS
Bridget R. Scanlon, PI: Water impacts on energy and economics in Texas (STARR)
Bridget R. Scanlon, PI: Water needed for power plant cooling (STARR)
REPORTS and PUBLICATIONS
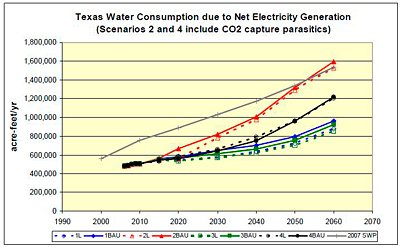
Water Demand Projections for Power Generation in Texas
Carey King, Ian Duncan, Michael Webber
[download PDF]
Energy and water are linked in many ways, and for electricity generation, the link is mainly as cooling water for the thermoelectric generation processes that account for over 95% of Texas' electricity. Any reduction in electricity demand will decrease the demand for water. Additionally, the use of water-conserving technologies at power generation facilities can lower water consumption, but for steam-based processes doing so often causes a concomitant drop in plant power efficiency. The growing use of wind power (2% of electricity in 2007), which practically consumes no water during operation, also plays an increasing role in decreasing Texas' water demand for electricity.
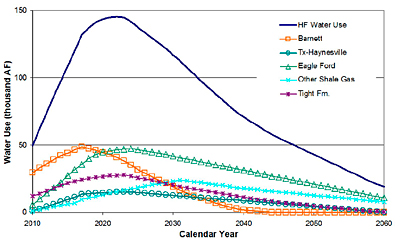
Current and future water demand of the Texas oil and gas and mining sectors and potential impact on aquifers
J.-P. Nicot
[download PDF]
The objectives of this study are to evaluate water use and consumption in the Texas mining and oil and gas sectors and to project future water use and consumption. Mineral resources in Texas fall into the categories of (1) oil and gas; (2) lignite and coal; (3) crushed rock, sand, and gravel (collectively known as aggregates); and (4) other substances. In 2008, roughly 160,000 acre-ft (AF) of water were used by the industries associated with these resources. Of this amount, approximately 35,000 AF were used for hydraulic fracturing and about 21,000 AF for other purposes in the oil and gas industry, while the coal and aggregate industries used 20,000 AF and 71,000 AF, respectively. Approximately 75% of this water was consumed, and approximately 66% of the consumed water was groundwater. Although operators favor surface water when it is present, groundwater is a more drought-resistant source. Projections call for a steady increase in water use in coal and aggregate production and a sharp increase, followed by a slow decrease, in the oil and gas industry. Mining withdrawals represent only 1% of total withdrawals at the state level, but at local levels they may compete with other water uses such as municipal use or irrigation.
REPORTS and PUBLICATIONS IN REVIEW
Energy Reliability Related to Water Availability under Climate Extremes in Texas
Robert Reedy, Bridget Scanlon
[Publication in review]
Abstract:
Understanding linkages between water and energy is critical during climate extremes, particularly droughts. With 40% reduction in per capita water storage since the 1980s, Texas is much more vulnerable to droughts now than in the past. Texas experienced the most extreme one year drought on record in 2011, with 60% reduction in precipitation and 40% reduction in reservoir storage relative to the long term mean. Power plants in Texas rely almost entirely on surface water for cooling. We evaluated water requirements for power plants based on fuel types and cooling technologies to assess their vulnerability to future droughts. Water demand was estimated for electricity generation using multiple sources, including Energy Information Agency, Texas Commission on Environmental Quality, and Texas Water Development Board. The following analysis reflects 2010 data; however, 2011 data will be analyzed as soon as they are made available. Analysis of 2010 data showed that Texas generated 411 million MWHr of electricity, mostly from natural gas (46%), coal (37%), nuclear (10%), and renewables (7%). Approximately 70% of net electricity generation in 2010 required water for cooling. Water consumption for electricity generation totaled 0.6 km3, which represents 3% of the states total water consumption in 2010 (22 km3). Water withdrawals totaled 28 km3; however, 97% of this water is returned to the system. Water consumption varies with fuel source (coal, natural gas, nuclear, renewables) and cooling system technology (once-through, pond, and recirculating tower). Coal plants accounted for the majority of water consumption in 2010, followed by natural gas, nuclear, and other. Water consumption varied by cooling system technology, with ponds accounting for most water consumption, followed by recirculating towers, and once-through cooling systems. The vulnerability of the different systems to drought was examined with water requirements for withdrawal and consumption relative to water availability. Approaches to increase drought resilience of energy production was also considered, including use of groundwater in addition to traditional surface water, managed aquifer recharge, and desalination.
Controls and Trends in the Water Footprint of Thermoelectric Generation: Case Study Texas, U.S.
Bridget R. Scanlon, Robert C. Reedy, Ian Duncan, William F. Mullican, and Michael Young
[Publication in review]
Abstract:
Estimating the water footprint of thermoelectric generation is critical for assessing water availability for power plants. The study objective was to quantify the water footprint of thermoelectric generation in terms of consumption and withdrawal, identifying controls and trends, using Texas as a case study. Water consumption in 2010 totaled ~ 0.54 km3 (0.44 million acre feet, maf), ~ 3% of total state water withdrawals. High water withdrawals (22.5 km3, 18.3 maf) mostly reflect circulation between ponds and power plants. Controls on water consumption include (1) generator technology/thermal efficiency and (2) cooling system resulting in statewide consumption for combined cycle plants with mostly cooling towers being 60% lower than that of steam turbines with mostly ponds. The primary control on water withdrawals is cooling system, with ~ two orders of magnitude lower withdrawals for wet cooling towers relative to ponds statewide. Long lifespans of power plants (≥ 30 – 50 yr) means that the current fleet is a legacy of past variations in fuel availability and costs, water availability and water rights, and technology advances. Recent reductions in consumption and withdrawal rates (L/kWh) in the late 1990s to early 2000s reflect large increases in natural gas combined cycle plants with cooling towers.

