Powderhorn Ranch Geoenvironmental Atlas
Wetlands Status and Trends
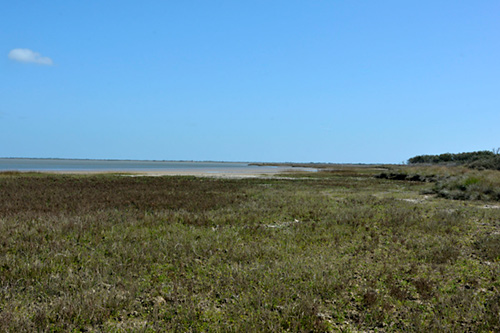
Mudflat and marsh along Powderhorn Lake
The Bureau of Economic Geology has undertaken coast-wide studies of the status and trends of wetlands and aquatic habitats along the Texas portion of the Gulf of Mexico. Coastal wetlands provide many vital functions including water quality enhancement by filtering runoff, flood protection and recharge through their action as natural sponges, buffers that reduce erosive forces from storm surges, high quality habitat that supports fish and shellfish production, migratory waterfowl, and many other species, and recreational opportunities. Wetland and aquatic habitats are essential components of inland and barrier island environments along the Texas coast. These valuable resources are highly productive biologically and chemically and are part of an ecosystem on which a variety of flora and fauna depend. Scientific investigations of wetland distribution and abundance through time are prerequisites to effective habitat management. They provide critical information for the preservation and protection of wetland functions and uses, and could guide mitigation and restoration projects. Moreover, studies of habitat status and trends contribute information to be incorporated in valuation studies of wetlands, that is, the types and areal extents of different wetlands from which ecosystem services can be quantified. Based on these studies, the BEG produced a series of GIS datasets and reports designed to determine the status and historical trends of wetlands and associated aquatic habitats.
The study of status and trends are based on wetlands interpreted and mapped on recent and historical aerial photographs. The most recent status of wetlands for the Powderhorn Ranch area was determined by mapping wetlands on color-infrared (CIR) photographs taken in 2008 (Tremblay and Calnan, 2010). Historical wetland distribution was based on 1956 black-and-white and 1979 CIR photographs.
The U.S. Fish and Wildlife Service (USFWS, 1983, unpublished digital data of wetland maps) mapped historical wetland distribution using methods established through the National Wetlands Inventory Program. Habitats were interpreted on the historical aerial photographs then transferred to 1:24,000-scale base maps using a zoom transfer scope. The maps were digitized and entered into a GIS. Sources of error for the mapping of historical wetlands includes the interpretation of wetland units, lack of field checking wetland boundaries, the transfer of mapped boundaries from aerial photographs to hardcopy maps, and digitization and registration of the historical maps. The BEG obtained the 1956 and 1979 wetland map GIS files from USFWS and partly revised them to be more consistent with wetlands interpreted on the 2008 photographs (Tremblay and Calnan, 2010).
The 2008 photographs were digital images with a 1 m pixel resolution and registered to U.S. Geologic Survey Digital Orthophoto Quadrangles (DOQ’s). Mapping of the wetland and aquatic habitats was done by interpreting and delineating habitats onscreen in a GIS at a scale of 1:5,000. This allowed for more detailed mapping. The current maps were used to make comparisons with the historical mapping to determine habitat trends (Tremblay and Calnan, 2010).
The wetland mapping by the USFWS and BEG follows the classification determined by Cowardin and others (1979) in Wetlands and Deepwater Habitats of the United States. Wetlands are classified by system (marine, estuarine, riverine, palustrine, lacustrine), subsystem (reflective of hydrologic conditions), and class (descriptive of vegetation and substrate). The systems represented in the Powderhorn Ranch area include estuarine, palustrine, and lacustrine (table WT1). The 1979 and 2008 maps were also classified by subclass (subdivisions of vegetated classes only), water regime (table WT2), and special modifiers. The 1956 wetlands were mapped only down to class.
A wetland trend analysis was completed by examining the distribution of wetland habitats as mapped in 1956, 1979, and 2008. Wetland classes were emphasized in the trend analysis over water regime and special modifiers, in part because wetland habitats were only mapped to the class level on the 1950s photography. Also water regime classification can be influenced by local or shore-term events such as precipitation (1950s Texas drought) and tidal cycles.
The estuarine system consist of many types of wetland habitats. Estuarine subtidal unconsolidated bottom (E1UBL 2008), or open water (E1OW 1956 and 1979), occurs in the bays and adjacent salt and brackish marshes. Unconsolidated shore (E2US 2008) includes tidal flats (E2FL 1956 and 1979) and bay beaches (E2BB 1979). The emergent areas around estuarine waters consist of low and high marshes (E2EM) that contain a variety of salt-tolerant and brackish-tolerant plants. Estuarine habitats extend landward to a point where salinity decreases to 0.5 ppt. The mapping of the boundaries between estuarine and palustrine systems is subjective based upon proximity to estuarine water bodies and vegetation types. A pond or emergent wetland is typically placed in the palustrine system if it is separated from the estuarine system by an upland break.
Table WT1. Wetland codes and descriptions from Cowardin and others (1979). Codes listed below were used in mapping the wetlands in the Powderhorn Ranch area based upon interpretation of 2008 photography. The codes varied in some cases from 1956 and 1979 maps.
| NWI code(water regime) | NWI description | Common description |
| E1AB3 | Estuarine, subtidal aquatic bed, rooted vascular | Estuarine seagrass |
| E1UB (L) | Estuarine, subtidal unconsolidated bottom | Estuarine bay |
| E2AB1 (P) | Estuarine, intertidal aquatic bed, algal | Algal mat |
| E2EM1 (N, P) | Estuarine, intertidal emergent, persistent | Estuarine bay marshes, salt and brackish water |
| E2US (M, N, P) | Estuarine, intertidal unconsolidated shore | Estuarine bay, tidal flats, beaches |
| L1UB (H) | Lacustrine, limnetic unconsolidated bottom | Lakes |
| PEM1 (A, C, F) | Palustrine, emergent persistent | Freshwater marshes, meadows, depressions, or drainage areas |
| PUB (H) | Palustrine, unconsolidated bottom | Pond |
| U | Upland | Upland |
Table WT2. Water-regime symbols and descriptions (Cowardin and others, 1979).
| Nontidal | |
| A | Temporarily flooded-surface water present for brief periods during growing season, but water table usually lies well below soil surface. Plants that grow both in uplands and wetlands are characteristic of this water regime. |
| C | Seasonally flooded-Surface water is present for extended periods, especially early in the growing season, but is absent by the end in most years. When surface water is absent, the water table is often near the land surface. |
| F | Semipermanently flooded-Surface water persists throughout the growing season in most years. When surface water is absent, the water table is usually at or very near the land surface. |
| H | Permanently flooded-Water covers land surface throughout the year in all years. |
| Tidal | |
| L | Subtidal-Substrate is permanently flooded with tidal water. |
| M | Irregularly exposed-Land surface is exposed by tides less often than daily. |
| N | Regularly flooded-Tidal water alternately floods and exposes the land surface at least once daily |
| P | Irregularly flooded-Tidal water floods the land surface less often than daily. |
Mapped palustrine areas included the following classes: unconsolidated bottom or open water ponds (PUB 2008, POW 1956 and 1979), unconsolidated shore (PFL 1956), aquatic bed (PAB 1979), emergent wetlands (PEM), and scrub-shrub (PSS 1956). The palustrine emergent wetlands are fresh or inland marshes not inundated by tidal waters. Open water bodies with a surface area greater than 8 ha are classed as lacustrine unconsolidated bottom (L1UB 2008) or open water (L1OW 1956). Lacustrine and palustrine unconsolidated bottom or open water were combined to represent fresh open water in the status report and trend analysis (figures W1 and W2).
.
Status of Wetlands and Aquatic Habitats, 2008
In 2008, wetland and aquatic habitats covered 2,359 ha within the Powderhorn Ranch study area (fig. W1, table WT3) and 4,959 ha was classified as uplands. The palustrine system is the largest of the wetland systems mapped covering 1,515 ha, 64% of all wetland and aquatic habitats (fig. W2). The mean elevation of palustrine marsh is 2.74 m above NAVD88. All emergent vegetated wetlands (E2EM and PEM) cover 2,111 ha. The estuarine intertidal emergent wetland habitat (E2EM) consists of 615 ha of salt or brackish marshes. This habitat makes up 26% of the study area, excluding the upland unit, with a mean elevation of 0.97 m. Approximately 132 ha of estuarine tidal flats and algal flats (E2US and E2AB) was mapped in the study area. The mean elevation of the tidal flats was 24 cm lower than the estuarine marshes. The total mapped area of palustrine and lacustrine open water (fresh) in Powderhorn Ranch was approximately 28 ha, around 1% of mapped wetland and aquatic habitats in 2008.
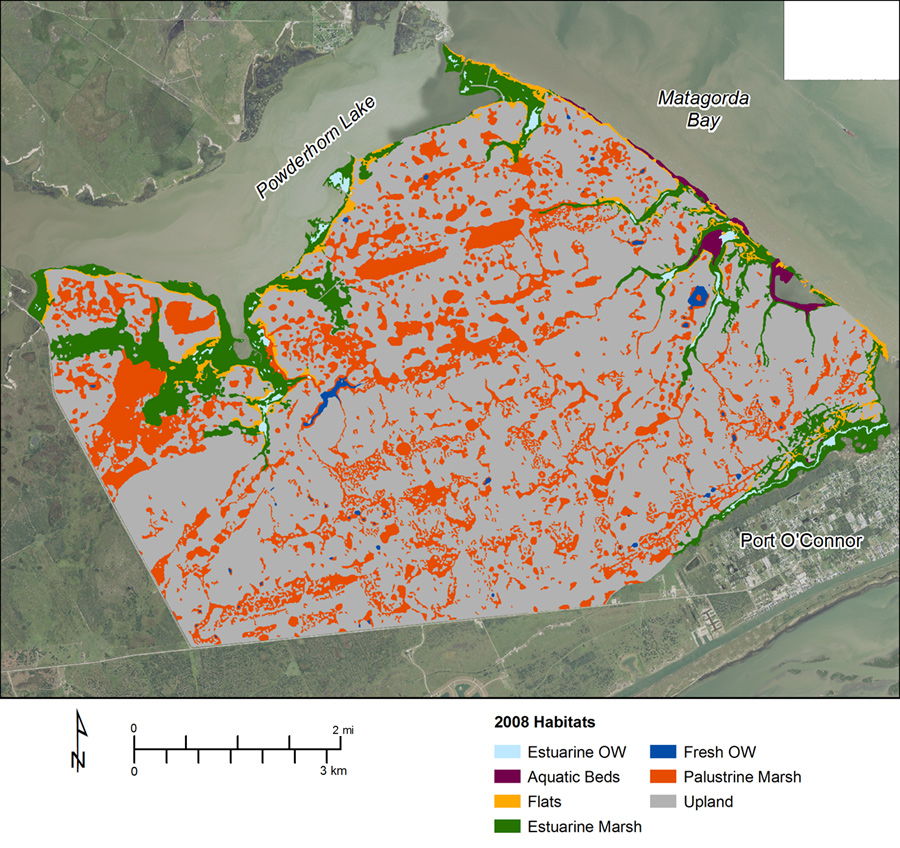
Figure W1. Areal distribution of major habitats on Powderhorn Ranch in 2008. Modified from Tremblay and Calnan (2010).
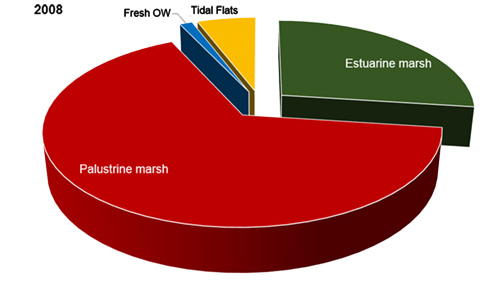
Figure W2. Areal extent of selected habitats in the Powderhorn Ranch area in 2008. Fresh open water (OW) in this figure includes palustrine and lacustrine waters.
Table WT3. Areal extent of mapped wetland and aquatic habitats, 2008.
| NWI Code | NWI Description | Hectares | Acres | % |
| E1AB3 | Estuarine Subtidal Aquatic Bed, Rooted Vascular | 39.17 | 96.79 | 2 |
| E1UBL | Estuarine Subtidal Unconsolidated Bottom | 48.25 | 119.23 | 2 |
| E2AB1P | Estuarine Intertidal Aquatic Bed, Algal | 0.42 | 1.04 | 0 |
| E2EM1N | Estuarine Intertidal Emergent Wetland, Regularly Flooded | 367.79 | 908.82 | 16 |
| E2EM1P | Estuarine Intertidal Emergent Wetland, Irregularly Flooded | 247.18 | 610.80 | 10 |
| E2USM | Estuarine Intertidal Flat, Irregularly Exposed | 4.04 | 9.99 | 0 |
| E2USN | Estuarine Intertidal Flat, Regularly Flooded | 16.52 | 40.82 | 1 |
| E2USP | Estuarine Intertidal Flat, Irregularly Flooded | 110.90 | 274.03 | 5 |
| L1UBH | Lacustrine Limnetic Unconsolidated Bottom, Permanently Flooded | 9.13 | 22.56 | 0 |
| PEM1A | Palustrine Emergent Wetland, Temporarily Flooded | 871.05 | 2,152.40 | 37 |
| PEM1C | Palustrine Emergent Wetland, Seasonally Flooded | 520.54 | 1,286.28 | 22 |
| PEM1F | Palustrine Emergent Wetland, Semipermanently Flooded | 104.45 | 258.11 | 4 |
| PUB | Palustrine Unconsolidated Bottom | 19.24 | 47.55 | 1 |
| Total | 2,359 | 5,828 | 100 |
Historical Trends in Wetland and Aquatic Habitats
Broad wetland classes were emphasized over water regimes in analyzing historical trends due to the limitations of the 1956 mapping. The total area of estuarine marshes increased from 580 ha in 1956 to 811 ha in 1979, then decreased to 615 ha in 2008 (figs. W3, W4; table WT4). Palustrine marsh increased from 771 ha in 1956 to 1,448 in 1979, a gain of almost 30 ha/yr. The total area of palustrine marsh in 2008 was similar (1,496 ha) to 1979, but the distribution of the habitat differed (fig W3). Fresh open water areas decreased by approximately half between 1956 (53 ha) and 1979 (27 ha) and remained stable in 2008 (28 ha). A reoccurring trend in wetland habitat studies along the Texas coast is the loss of tidal flats through time (Tremblay and Calnan, 2010). In the Powderhorn Ranch study area, tidal flats covered 282 ha in 1956 and were reduced to 111 ha in 1979. There was a slight increase of tidal flats to 132 ha in 2008. The overall tidal flat habitat was reduced by 53% between 1956 and 2008 at a rate of 3 ha/yr.
Analysis of trends in wetlands and aquatic habitats in the Powderhorn Ranch area show that there was a slight net increase in marshes from 1956 through 2008. Emergent wetlands (both estuarine and palustrine) increased from 1,352 ha to 2,111 ha, a gain of 759 ha (fig. W5). Marsh area fluctuated through the study time period. The rate of marsh gain from 1956 to 1979 was 39 ha/yr, and from 1979 to 2008 marsh lost 5 ha/yr. The long-term (1956-2008) change rate of marsh was a gain of 15 ha/yr.
Although areas of fresh open water decreased over time, the increase of emergent marsh habitats between 1956 and 1979 may be due to the wetter conditions during the later period. The severe drought that occurred in Texas in the 1950s, peaked in 1956 (Riggio and others, 1987) limiting the extent of marsh habitats. The increase in palustrine marsh into upland habitat between 1956 and 2008 may be due to wetter conditions in the later time periods. The decrease in estuarine marshes between 1979 and 2008 may be due to relative sea level rise and partly due to interpretational differences between mapping periods (Tremblay and Calnan, 2010).
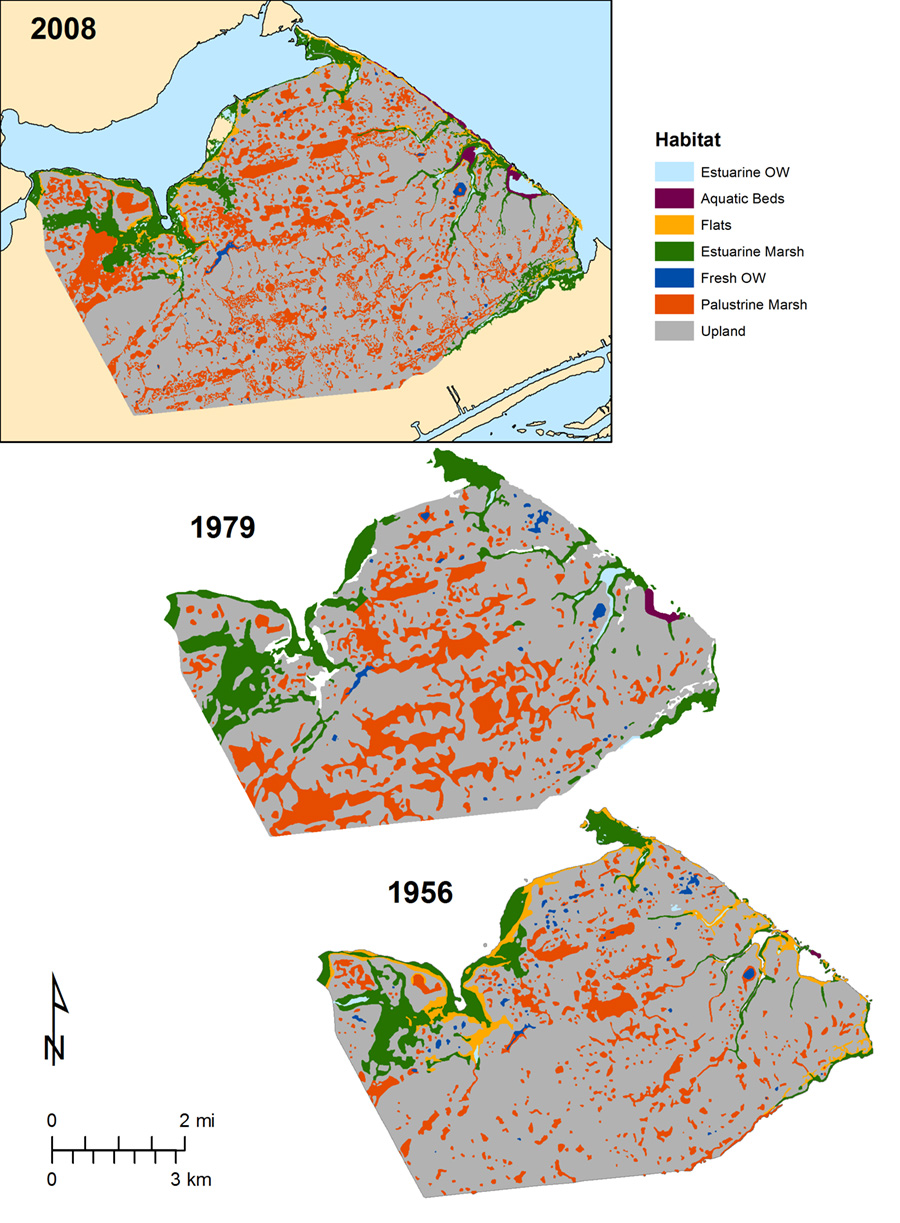
Figure W3. Maps showing distribution of major wetland and aquatic habitats in 2008, 1979, and 1956 in the Powderhorn Ranch area. Modified from Tremblay and Calnan (2010).
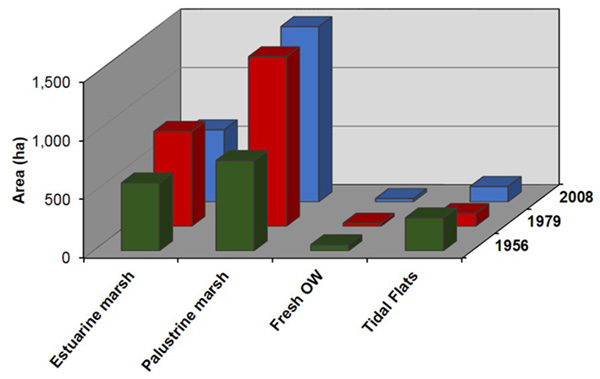
Figure W4. Areal distribution of habitats in Powderhorn Ranch in 1956, 1979, and 2008
Table WT4. Total area (ha and acres) of major habitats, including uplands, in 1956, 1979, and 2008.
| Habitat | 1956 | 1979 | 2008 | |||
| ha | acres | ha | acres | ha | acres | |
| Estuarine marsh | 580 | 1,434 | 811 | 2,004 | 615 | 1,520 |
| Palustrine marsh | 771 | 1,906 | 1,448 | 3,578 | 1,496 | 3,697 |
| Fresh OW | 53 | 132 | 27 | 68 | 28 | 70 |
| Tidal Flats | 282 | 697 | 111 | 273 | 132 | 326 |
| Uplands | 5,291 | 13,819 | 4,872 | 12,039 | 4,959 | 12,253 |
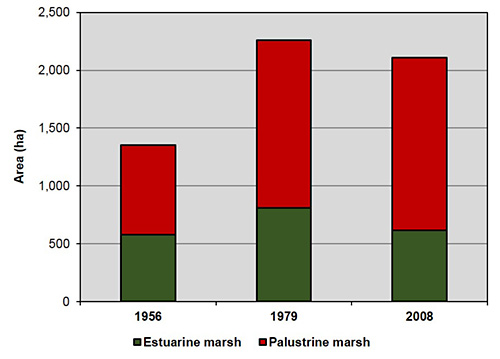
Figure W5. Areal distribution of emergent marsh habitats in Powderhorn Ranch in 1956, 1979, and 2008.
References
Cowardin, L.M., Carter, V., Golet, F.C., and LaRoe, E.T., 1979. Classification of wetlands and deepwater habitats of the United States. U.S. Department of Interior, Fish and Wildlife Service, Washington, D.C., USA 131p.
Riggio, R.R., Bomar, G.W., and Larkin, T.J., 1987, Texas drought: its recent history (1931-1985). Texas Water Commission, LP 87-04, 74p.
Tremblay, T.A., and Calnan, T.R., 2010. Status and Trends of Inland Wetland and Aquatic Habitats, Matagorda Bay Area. Austin, Texas: University of Texas at Austin, Bureau of Economic Geology Report Prepared for General Land Office Contract 09-046 and National Oceanic and Atmospheric Administration Award NA08NOS4190458, 71p.
White, W. A., Calnan, T. R., Morton, R. A., and others, 1989, Submerged Lands of Texas, Port Lavaca Area: Sediments, Geochemistry, Benthic Macroinvertebrates, and Associated Wetlands: The University of Texas at Austin, Bureau of Economic Geology, SL0007, 165 p.