Shoreline Change and Beach/Dune Morphodynamics Along the Gulf Coast
We conducted three annual airborne lidar surveys along the Texas Gulf shoreline in 2010, 2011, and 2012 to determine short-term shoreline change and its long-term context, map critical beach and dune attributes including the shoreline, potential vegetation line, and landward dune boundary, examine and quantify beach and dune morphology by determining elevation-threshold area (ETA) curves for differing geomorphic environments on the Texas coast, and establish a storm susceptibility index (SSI) for the Gulf shoreline.
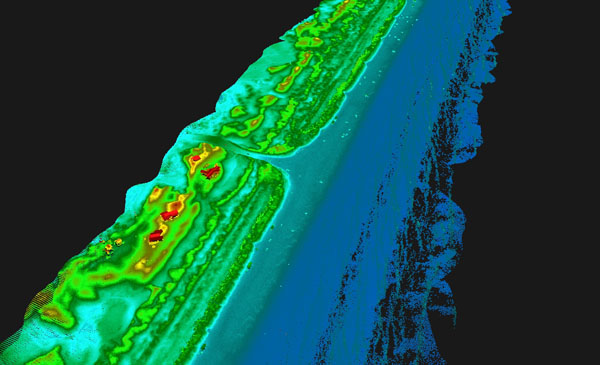
Figure 1. 2012 lidar point cloud data sample from Mustang Island. Points colored red are highest elevation, blue points are the lowest. On average, long-term shoreline change trends are erosional for all major Texas coastal segments. Over the short term, the Texas Gulf shoreline advanced an average of 6.5 m between 2010 and 2011, a period that was characterized by continued long-term recovery from Hurricane Ike (2008). The shoreline advanced at 75 percent of monitoring sites during this period. This trend largely reversed between 2011 and 2012, when the shoreline retreated at 67 percent of monitoring sites over an average distance of 3.1 m landward. Coastwide shoreline change patterns were similar to long-term trends during this period. The most stable or advancing shorelines were located on the central Texas coast. Shorelines along the upper and lower parts of the coast generally retreated. Predominant shoreline retreat between 2011 and 2012 did not fully offset advance in 2010 to 2011. Between 2010 and 2012, the shoreline advanced at 59 percent of sites over an average distance of 3.4 m, resulting in a net beach gain of 203 ha.
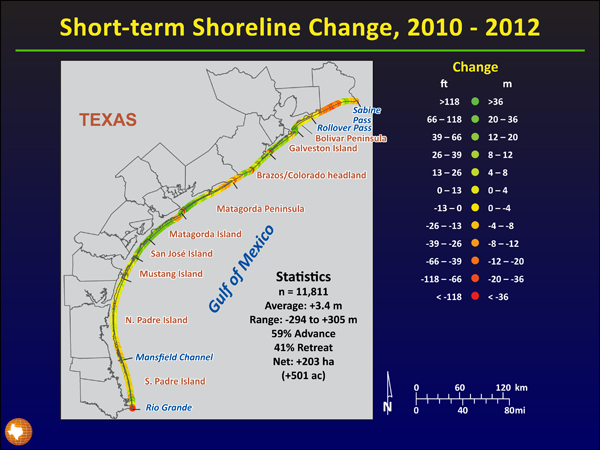
Figure 2. Net shoreline change between April 2010 and February 2012 from Sabine Pass to the Rio Grande. Change calculated from shoreline positions determined from airborne lidar surveys. Positive values indicate shoreline advance; negative values indicate shoreline retreat.
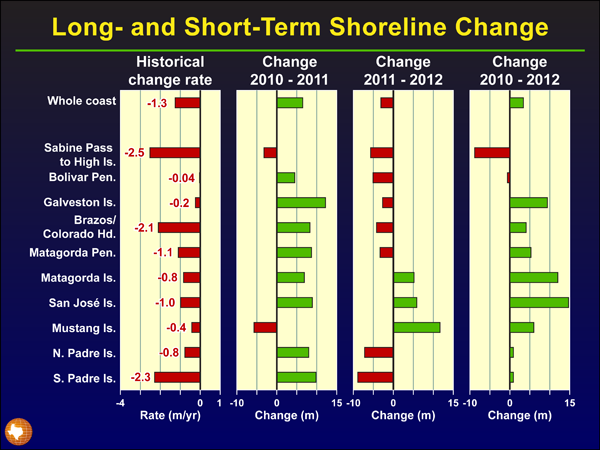
Figure 3. Comparison of incremental shoreline change measured between 2010 and 2012 with long-term shoreline change along the Texas Gulf shoreline.
Digital elevation models (DEMs) constructed from airborne lidar data were used to determine elevation-threshold area (ETA) curves for major geomorphic units and each coastal county. Areas exceeding threshold elevations of 2 to 9 m (in 1-m increments) have characteristic shapes that are useful in determining sand storage volumes, susceptibility to storm flooding, and erosion resistance and recoverability. DEMs were also used to create an eight-level storm susceptibility index (SSI) that indicates the predicted protection level from storms at recurrence intervals of 1 to 200 years.
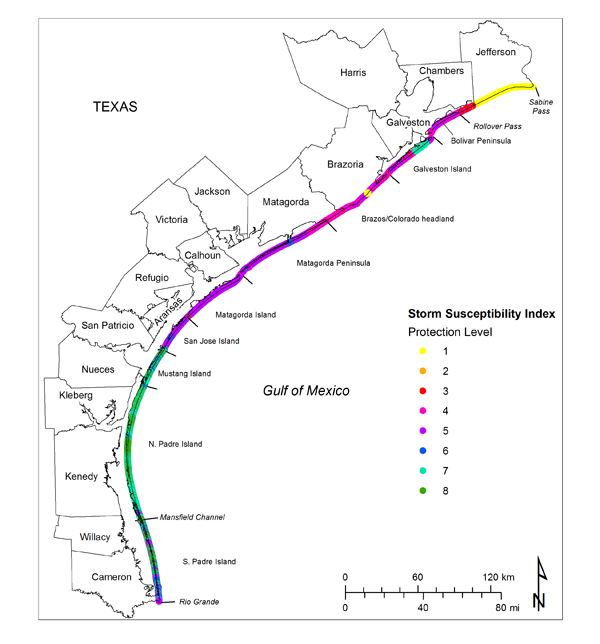
Figure 4. Storm Susceptibility Index protection levels determined for the Texas coast. Lowest storm susceptibility levels (protection against a 1-year storm or less) are found along all of Jefferson County on the upper Texas coast. Shorelines with the highest storm susceptibility levels (protection against a 200-year storm) are found on North Padre Island. SSI data is from Harte Research Institute.
Interactive map showing long-term and short-term (2010 through 2012) shoreline change
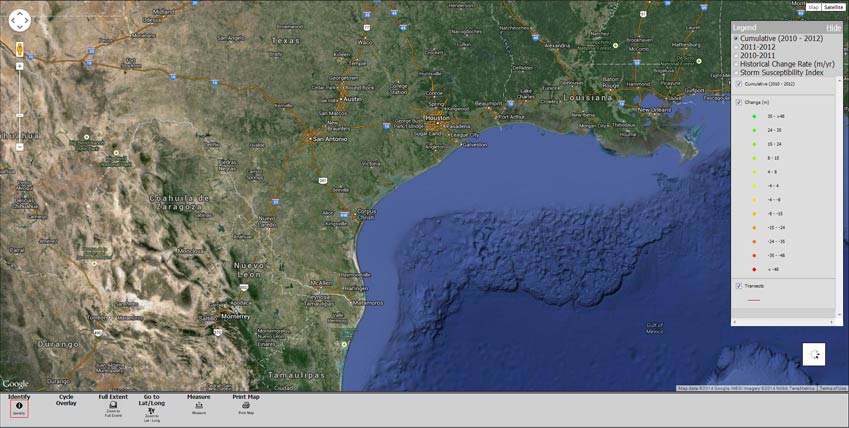
Interactive map showing long-term and short-term (2010 through 2012) shoreline change and storm susceptibility along the Texas Gulf shoreline
Data Download
2010 GIS files
- Shoreline
- UTM Zone 14 [3.0 Mb zip]
- UTM Zone 15 [2.7 Mb zip]
Potential Vegetation Line- UTM Zone 14 middle coast [5.9 Mb zip]
- UTM Zone 14 south coast [7.9 Mb zip]
- UTM Zone 15 [14.6 Mb zip]
Dune Boundary- UTM Zone 14 middle coast [0.4 Mb zip]
- UTM Zone 14 south coast [0.6 Mb zip]
- UTM Zone 15 [0.2 Mb zip]
2011 GIS files
- Shoreline
- UTM Zone 14 [2.9 Mb zip]
- UTM Zone 15 [2.0 Mb zip]
Potential Vegetation Line- UTM Zone 14 [2.3 Mb zip]
- UTM Zone 15 [2.9 Mb zip]
Dune Boundary- UTM Zone 14 [1.0 Mb zip]
- UTM Zone 15 [0.7 Mb zip]
2012 GIS files
- Shoreline
- UTM Zone 14 [3.0 Mb zip]
- UTM Zone 15 [1.9 Mb zip]
Potential Vegetation Line- UTM Zone 14 [2.6 Mb zip]
- UTM Zone 15 [1.9 Mb zip]
Dune Boundary- UTM Zone 14 [1.0 Mb zip]
- UTM Zone 15 [.6 Mb zip]
Shoreline Change GIS files
- 2010-2011 (change2010_2011.zip)
- 2011-2012 (change2011_2012.zip)
- 2010-2012 (change2010_2012.zip)
- Long-term thru 2007 (longTermTo2007.zip)
Storm Susceptibility Index GIS files
Final Technical Report
- CIAP Gulf Shoreline [7.18 MB pdf]
Presentation
- 2013 ASBPA National Coastal Conference [7.09 MB pdf]
Sponsors and Collaborators
This project was supported by a grant from the General Land Office of Texas to the Bureau of Economic Geology, The University of Texas at Austin. The study was funded in part by a financial assistance award from the U.S. Department of the Interior, U.S. Fish and Wildlife Service, Coastal Impact Assistance Program. The views expressed are those of the authors and do not necessarily reflect the views of the U.S. Fish and Wildlife Service. The goal of the Texas CIAP is to conserve, restore, enhance, and protect the diversity, quality, quantity, functions, and values of the state's coastal natural resources.
Collaborators for this project are the Coastal and Marine Geospatial Sciences Laboratory at Harte Research Institute for Gulf of Mexico Studies and Conrad Blucher Institute for Surveying and Science at Texas A&M University Corpus Christi.
Weblinks for Sponsors and Collaborators:
Texas CIAP: http://www.glo.texas.gov/what-we-do/caring-for-the-coast/grants-funding/ciap/index.html
BOEMRE: http://www.boemre.gov/
GLO: http://www.glo.texas.gov/what-we-do/caring-for-the-coast/index.html
HRI: http://www.harteresearchinstitute.org/index.php?option=com_content&view=article&id=38&Itemid=173
CBI: http://www.cbi.tamucc.edu/