Historical Shoreline Movement in Galveston, Trinity, East, and West Bays on the Upper Texas Gulf Coast
Project Team: Tiffany L. Caudle and Jeffrey G. Paine
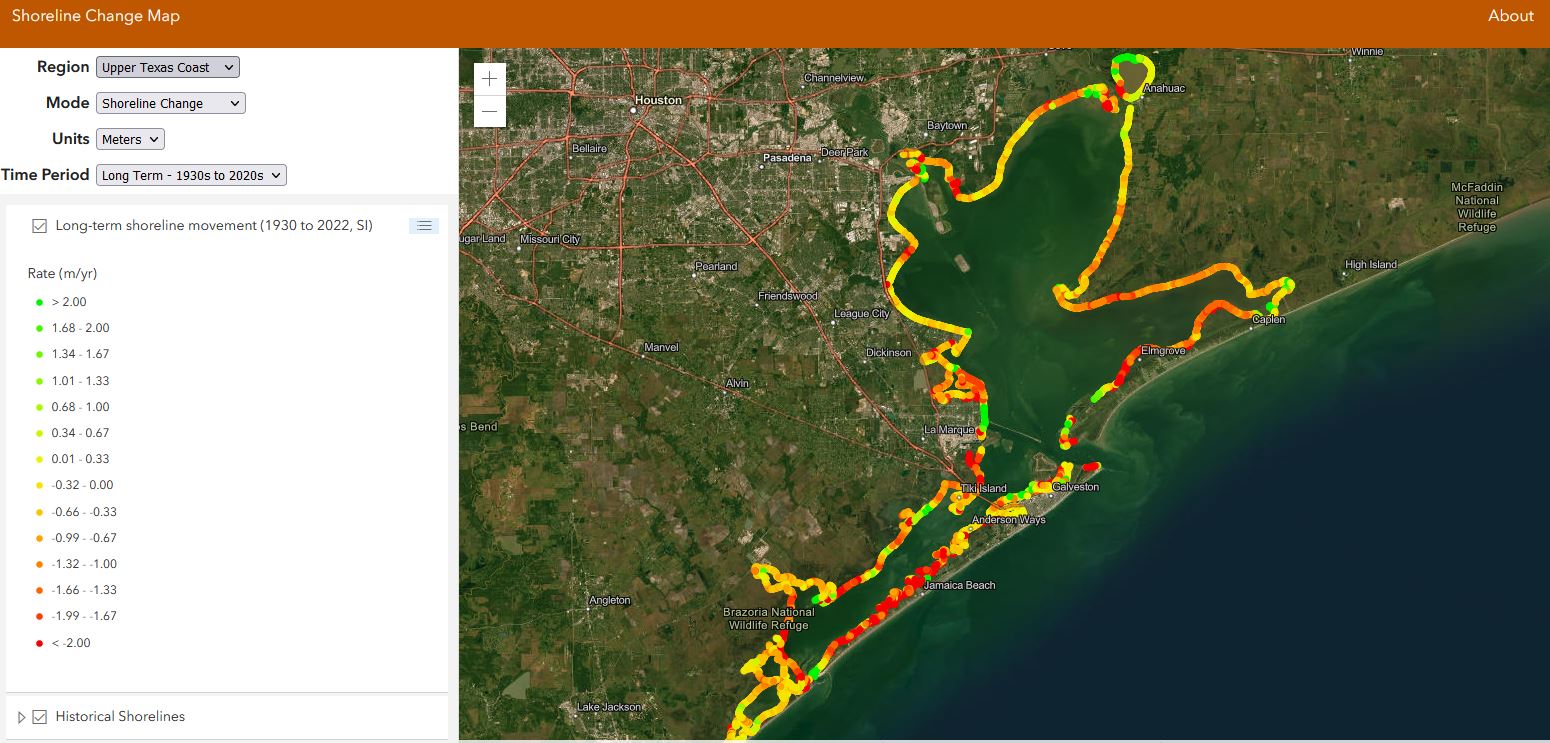
Online Viewer
View long-term and more recent shoreline change, shoreline types, and erosion susceptibility in the Galveston Bay system using the interactive, online viewer.
Summary
The Galveston Bay system (Galveston, Trinity, East, and West Bays) is an environmentally sensitive area on the upper Texas coast. This project updated rates of shoreline movement from multiple time periods, characterized shoreline types, and assessed vulnerability to sea-level change along bay shorelines within the Galveston Bay system. Results from this project can be used to better understand past natural and human causes of shoreline change and manage future uses of the bay system and associated shorelines in the context of past and likely future change.
A current shoreline position for the Galveston Bay system was extracted from a combination of airborne lidar surveys from 2017 and 2018 and aerial photography from 2020 and 2022. This recent shoreline position was compared with previous shoreline positions determined from aerial photographs from 1930, 1956, and 1982 to determine shoreline-movement and land-loss rates for two longer-term time frames (1930 to 2022 and 1956 to 2022) and a more recent period (1982 to 2022). The lidar and photography were also used to classify approximately 500 km of bay shoreline into 11 natural shoreline types. From higher to lower elevation adjacent to the shoreline, the common shoreline types are high and low Pleistocene clayey sand and sandy clay bluffs, Pleistocene sandy slopes, fan deltas, sandy and shelly beaches and spits, tidal passes, flood-tidal delta marshes and tidal flats, deltaic marshes, and back-barrier and bay-margin marshes and tidal flats. The lower-elevation shoreline types (back-barrier and bay-margin marsh and tidal flats) are the most common shoreline types in the bay system, together constituting 47 percent of the total shoreline length. Two additional categories, levee and modified shore, were used when the shoreline had been altered to the extent that characteristics of the original shoreline environment were no longer recognizable.
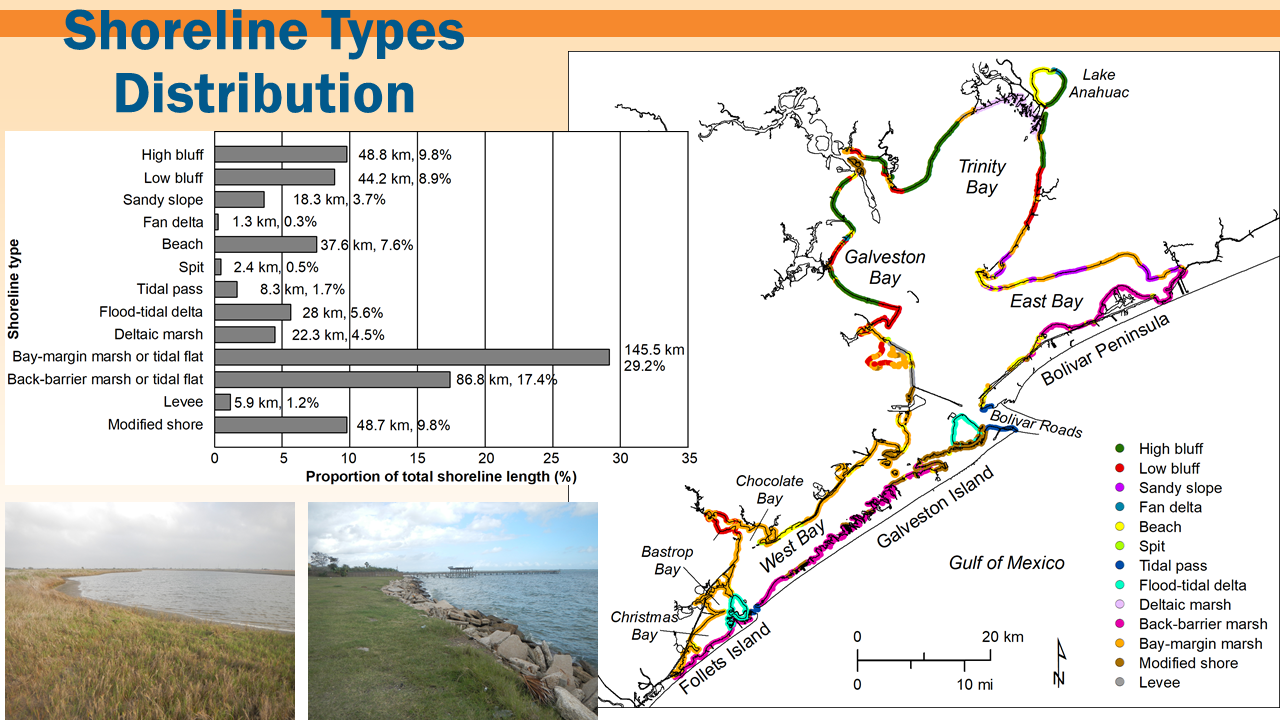
Fig 1. Distribution and proportion of principal shoreline types in the Galveston Bay system including photos of back-barrier marsh on Galveston Island (left) and a low bluff shoreline with rip rap along Galveston Bay near LaPorte (right).
Shoreline movement was dominantly erosional over the three time periods. During the longest time period, 1930 to 2022, 83 percent of the measurement sites retreated at an average rate of 0.78 m/yr (Fig. 2). Between 1956 and 2022, 82 percent of sites retreated at an average rate of 0.99 m/yr (Fig. 3). During the more recent period (1982 to 2022), net shoreline retreat averaged -1.05 m/yr for the Galveston Bay system, translating to an average land-loss rate of 52.40 ha/yr (Fig. 4). Average shoreline retreat rates were highest in East Bay at -0.95, -1.16, and -1.44 m/yr for the three observation periods, followed by West Bay retreat rates at -0.86, -1.23, and -1.39 m/yr, Galveston Bay at -0.77, -0.76, and -0.55 m/yr, and Trinity Bay at -0.38, -0.57 and -0.45 m/yr. The shoreline type experiencing the highest rates of retreat between all three time periods were the back-barrier marsh or tidal flat; (-1.39 m/yr between 1930 and 2022, -2.02 between 1956 and 2022, and -2.17 m/yr between 1982 and 2022. The only shoreline types to experience advancement during all three periods were spits and tidal pass.
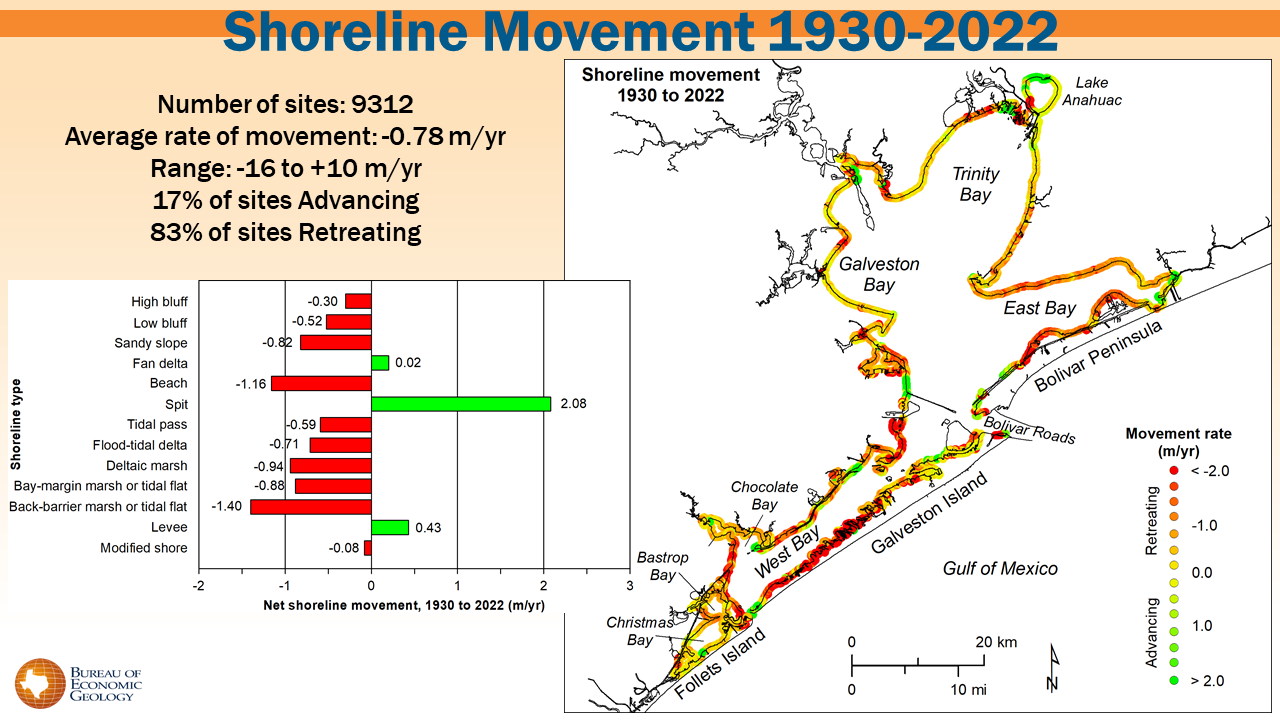
Figure 2. Net rates of long-term shoreline movement around the Galveston Bay system calculated from shoreline positions from 1930 to 2022 and average net shoreline movement rates for common bay shoreline types.
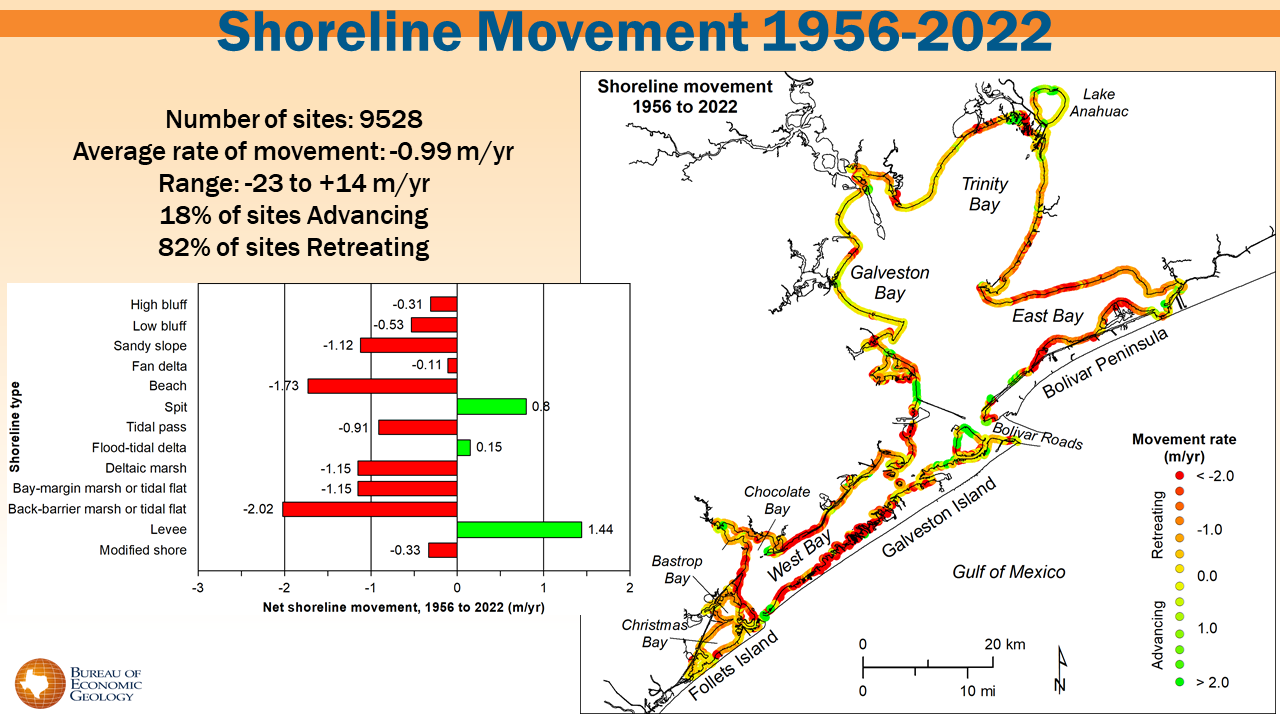
Figure 3. Net rates of long-term shoreline movement for the Galveston Bay system calculated from shoreline positions from 1956 to 2022 and average net shoreline movement rates for common bay shoreline types.
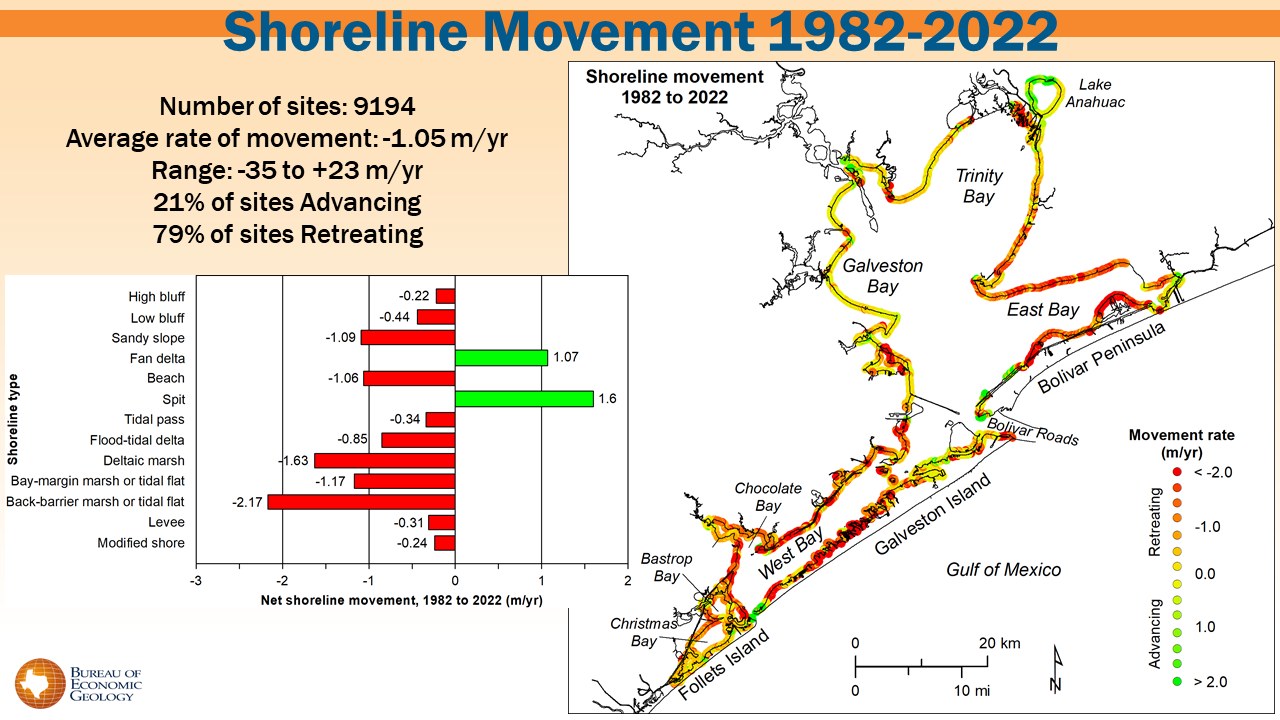
Figure 4. Net rates of recent shoreline movement for the Galveston Bay system calculated from shoreline positions from 1982 to 2022 and average net shoreline movement rates for common bay shoreline types.
Acknowledgements
This project was funded in part by a Texas Coastal Management Program grant approved by the Texas Land Commissioner, providing financial assistance under the Coastal Zone Management Act of 1972, as amended, awarded by the National Oceanic and Atmospheric Administration (NOAA), Office for Coastal Management, pursuant to NOAA Award No. NA22NOS4190148. The views expressed herein are those of the author(s) and do not necessarily reflect the views of NOAA, the U.S. Department of Commerce, or any of their subagencies. The award was administered through grant no. 23-020-016-D610 from the General Land Office of Texas to the Bureau of Economic Geology, The University of Texas at Austin.
Results of this project are discussed in a comprehensive report cited as:
Caudle, T. L. and Paine, J. G., 2024, Historical Shoreline Movement in Galveston, Trinity, East and West Bays on the Upper Texas Gulf Coast: Bureau of Economic Geology, The University of Texas at Austin, Final Report prepared for General Land Office under contract no. 23-020-016-D610, 82 p.