
AEC Test of Remote Fracture Mapping at Devine Test Site
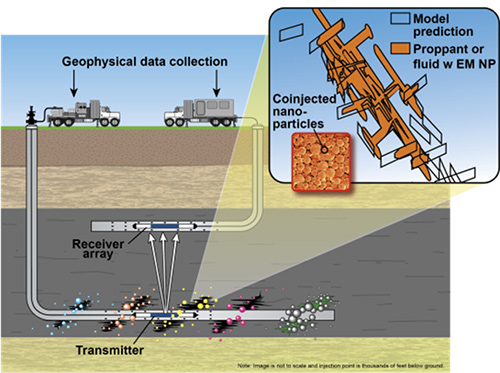
Figure 1. AEC researchers are currently investigating the potential of using EM technology to provide better-quality information to infer the geometry and productivity of hydraulic fractures.
Over the past 2 years, the Bureau of Economic Geology’s Advanced Energy Consortium (AEC) has been conducting downhole tests of its electromagnetic (EM) proppants at the Bureau’s Devine Test Site in South Texas. The tests are run to help identify the location of proppants and fluids in hydraulic and natural fractures near the wellbore and in the inter-well space with greater accuracy than current technology allows. Characterizing hydraulic fracture geometries (fracture height, length, spacing, orientation, and shape) is key when trying to maximize oil and gas production and ultimate recovery within a field. Last year, an approximately 300-ft-deep well was fracked using EM proppant in an effort to characterize the resulting fracture pattern.
To validate these results, nearby offset wells that transected the fracture pattern of the fracking operation were drilled and cored. Fractures and EM proppant from the fracked well were clearly visible in the cores.
Recently, as a secondary check, the Bureau’s Near Surface Observatory (NSO)—with its principal investigator Jeffrey Paine and research scientist associate Lucie Costard—brought NSO logging equipment to the site to log the new offset wells. Conductivity, gamma-ray, and mini-resolution logs were run in the wells in an effort to sense the EM proppant in fractures and to correlate those readings with what is observed in the actual cores. Analysis of the results is ongoing, but the initial results of the experiment have been very positive.
Mohsen Ahmadian, AEC program manager and lead researcher on the experiment, said, “If we validate the experimental model with this test, we may one day soon be able to use this technology at scale.”
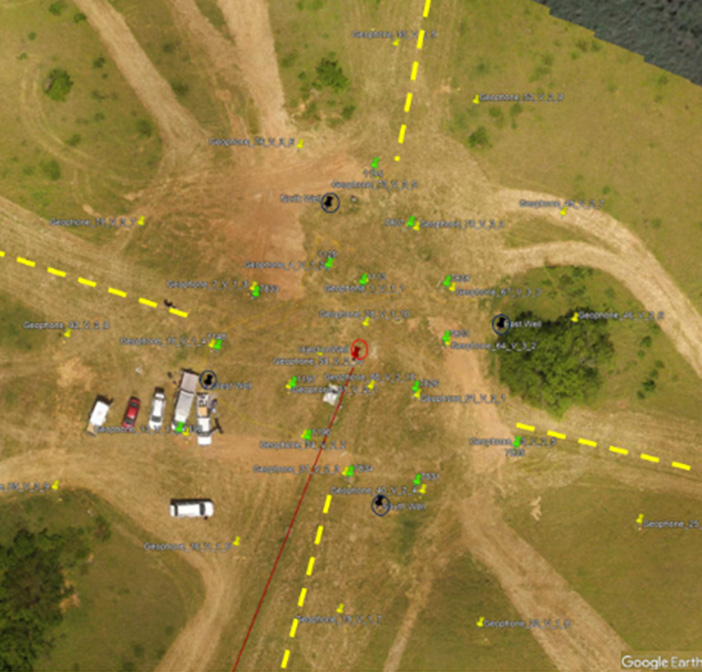
Figure 2. Aerial view of AEC’s inverted five-spot well pattern at the Devine Test Site that was fractured in 2017. Injection well is shown with red circle; instrumented observer wells are shown with black circles; surface ERT arrays are shown with yellow dashed lines; surface geophones and tilt-vault locations are indicated by green markers.
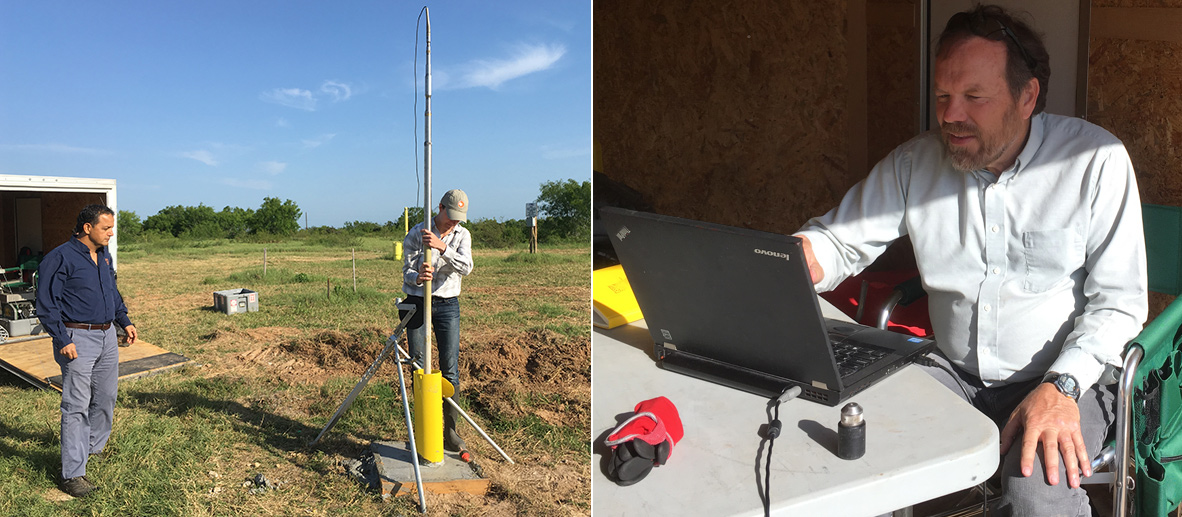
Left: Mohsen Ahmadian looks on as Lucie Costard adjusts an EM induction logging tool. Right: Jeff Paine reviews incoming data.

