From 2006 through mid-2018, there have been 125 Mw ≥ 2.5 recorded earthquakes within the Fort Worth Basin and the Dallas-Fort Worth metropolitan area. There is general scientific consensus that this increase in seismicity has been induced by increases in pore-fluid pressure from wastewater injection and from cross-fault pore-pressure imbalance due to injection and production. Previous fault stress analyses indicate that many of the faults are critically stressed; therefore, careful consideration should be taken when injecting in close proximity to these structures. Understanding the structural characteristics that control geomechanical aspects of these earthquake-prone faults is vital in characterizing this known hazard. To improve understanding of faults in the system, we have developed a characterization using a new basin-wide fault interpretation and database that has been assembled through the integration of published data, 2D and 3D seismic surveys, outcrop mapping, earthquakes, and interpretations provided by operators resulting in a 3D structural framework of basement-rooting faults. Our results show that a primary fault system trends northeast–southwest, creating a system of elongate horsts and grabens. Fault architectures range from isolated faults to linked and cross-cutting relay systems with individual segments ranging in length from 0.5 to 80 km. The faults that have hosted earthquakes are generally less than 10 km long, trend toward the northeast, and exhibit more than 50 m of normal displacement. The intensity of faulting decreases to the west away from the Ouachita structural front. Statistical analysis of the fault length, spacing, throw, and linkage tendency enables a more complete characterization of faults in the basin, which can be used to mitigate the seismic hazard. Finally, we find that a significant percentage of the total population of faults may be susceptible to reactivation and seismicity as those that have slipped recently.
Horne, E.A., Hennings, P.H., Osmond, J.L., and Deshon, H.R., 2020, Structural characterization of potentially seismogenic faults in the Fort Worth Basin: Interpretation, v. 8, no. 2, p. T323–T347, https://doi.org/10.1190/INT-2019-0188.1.
Horne, E.A., Smye, K.M., and Hennings, P.H., 2022, Structure and characteristics of the basement in the Fort Worth Basin, in Callahan, O.A. and Eichhubl, P. eds., The Geologic Basement of Texas: A Volume in Honor of Peter T. Flawn: The University of Texas at Austin, Bureau of Economic Geology Report of Investigations No. 286, https://doi.org/10.23867/RI0286C7
Downloadable Data
Faults associated with this research are publicly available as GIS Shapefiles within the Texas Data Repository and can be accessed through the Digital Object Identifier (DOI) system with DOI: 10.18738/T8/5EDCKC.
Supplemental data for all TexNet-CISR research in the Dallas-Fort Worth Basin are archived at: https://dataverse.tdl.org/dataverse/texnet-cisr-dfw.
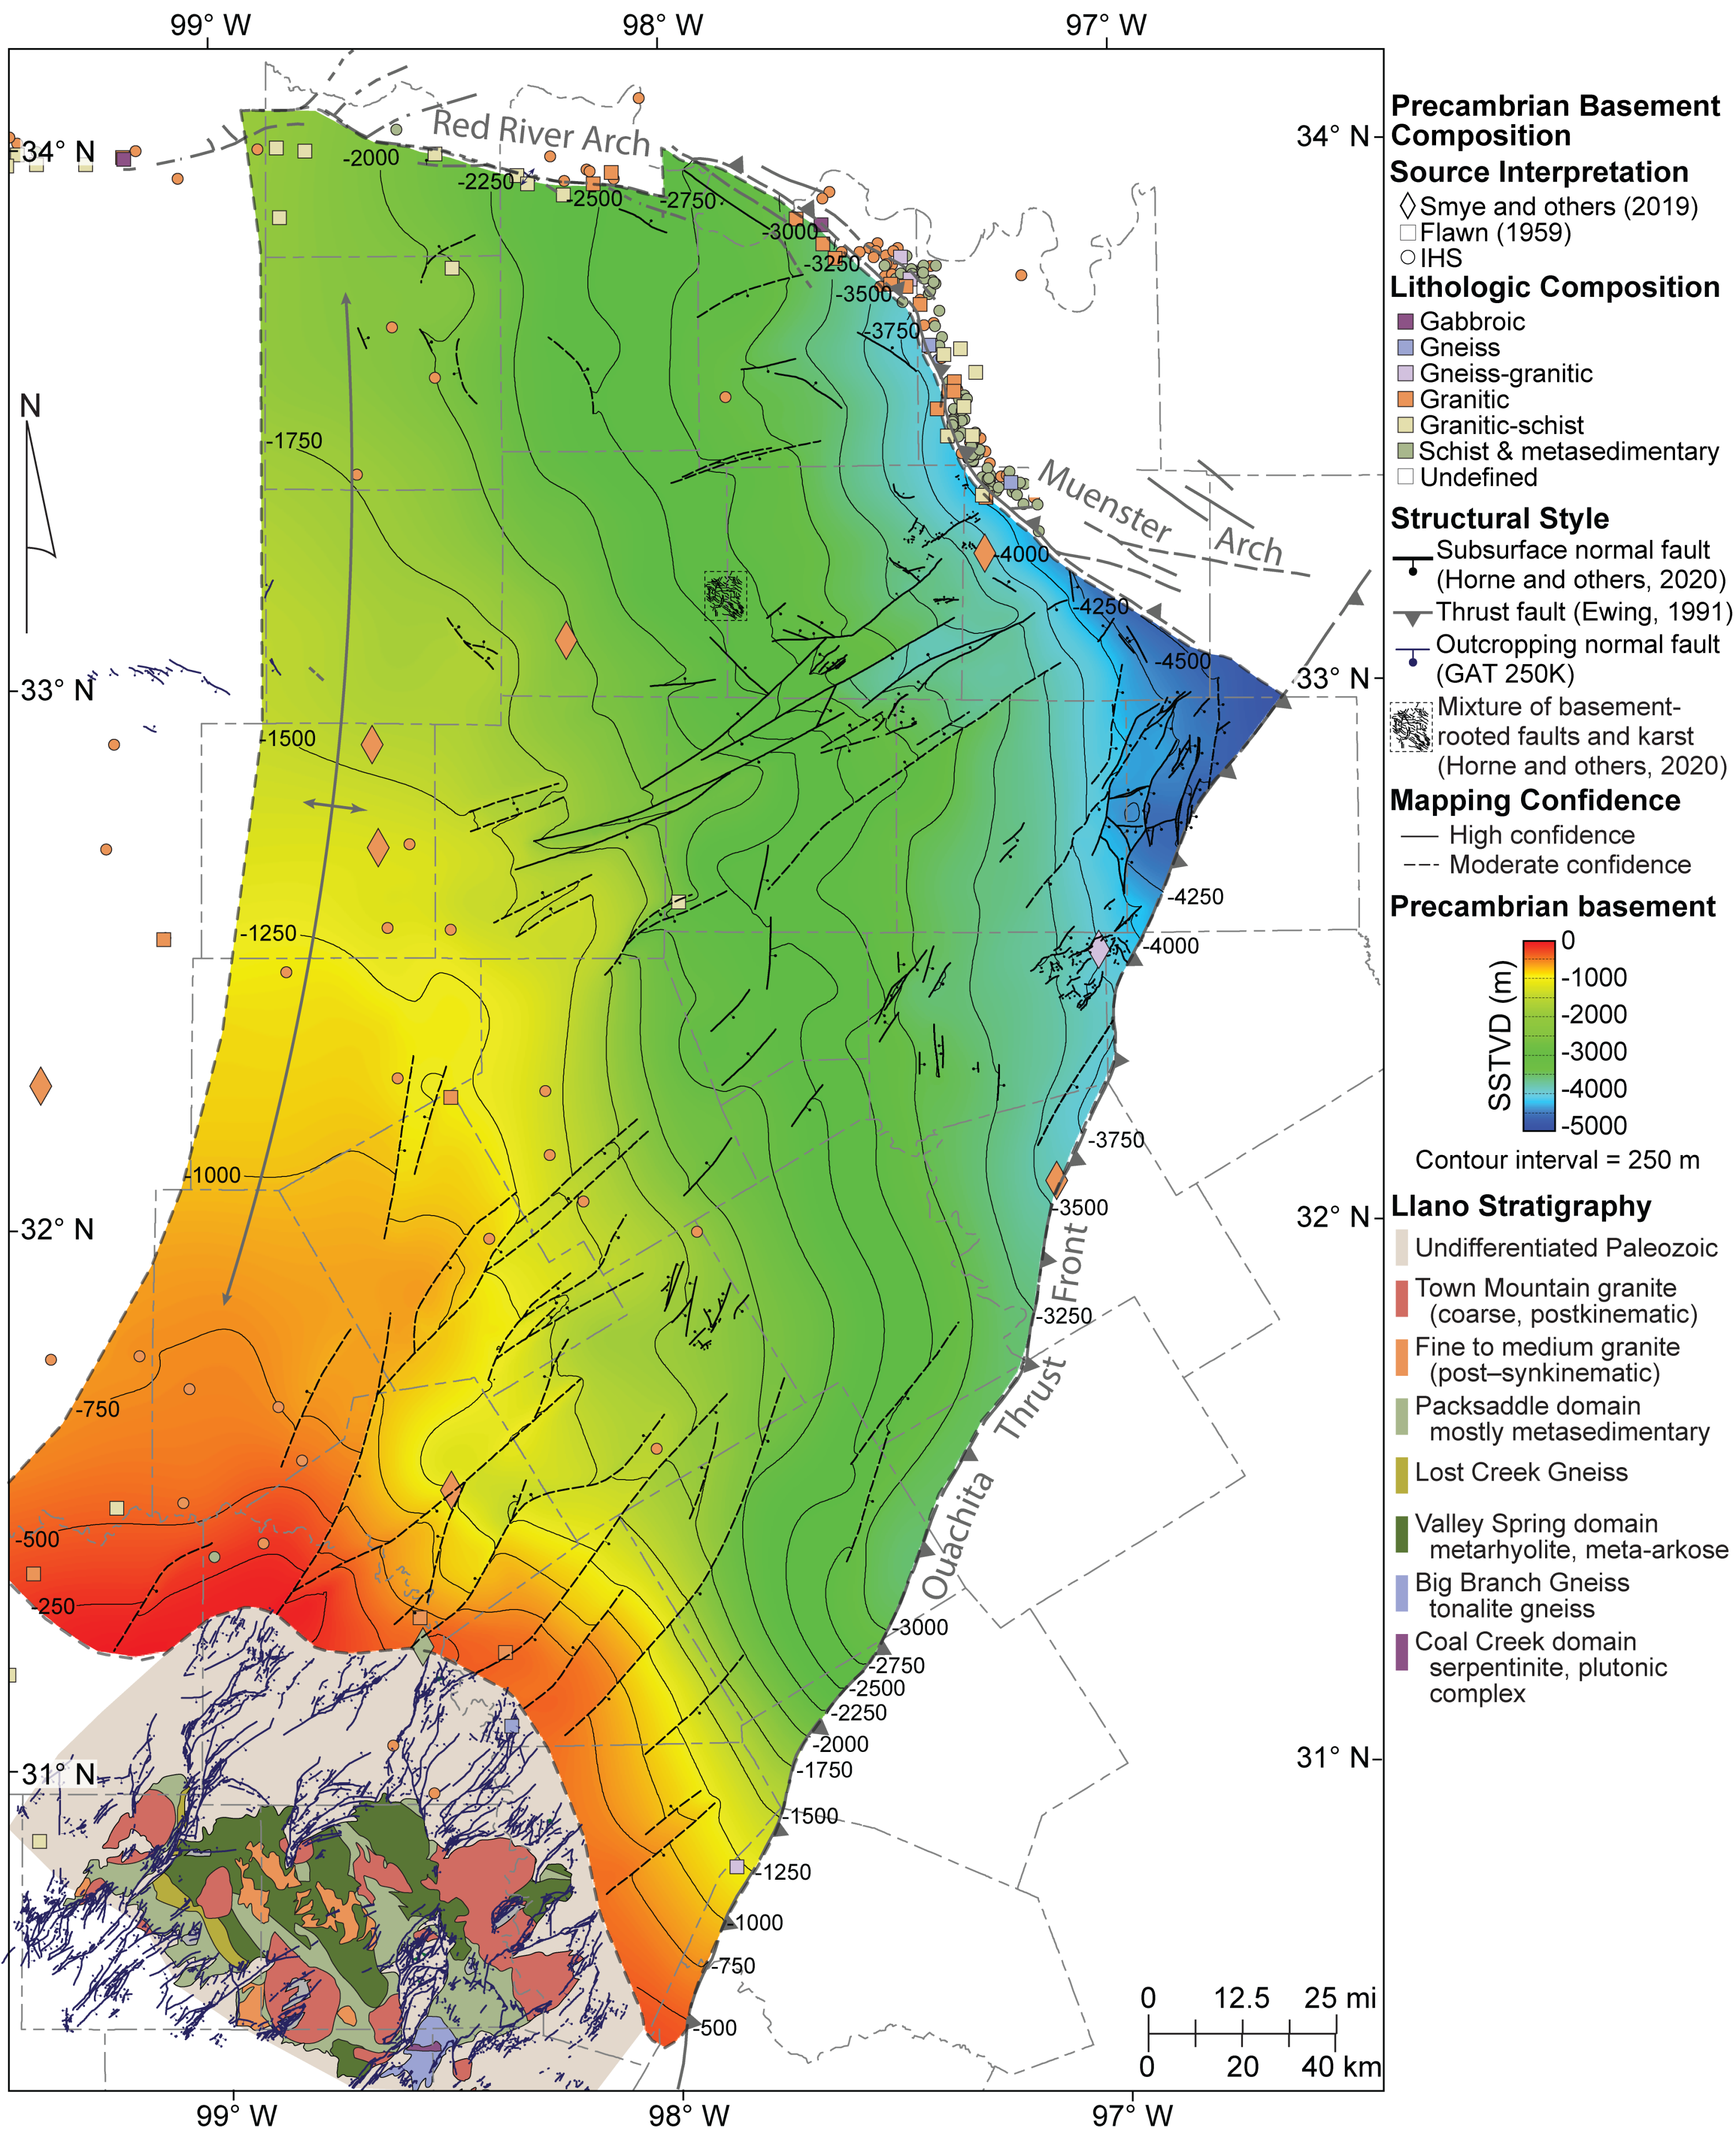
FWB1: Structural contour map of top-Precambrian basement in the Fort Worth Basin and geology of the Llano Uplift. Basement-rooted normal fault traces are shown as the solid and dashed black traces, symbolizing high- and moderate-confidence interpretations, respectively (Horne and others, 2020). The approximate traces for main tectonic features, including the Muenster Arch and Ouachita thrust front, are highlighted in gray. Outcropping fault traces are shown in dark blue, and outcropping units mapped come from the Geologic Atlas of Texas (GAT 250K). Wells used for both Ellenburger and Precambrian basement petrophysical interpretations are also shown. Top-Precambrian basement surface has been colored to reflect depth in meters subsea true vertical depth (SSTVD). Structural contours highlight fault offset mapped. Figure and caption taken from Horne et al. (2022).
Dataset & interpretation confidence
Data sources include interpretations from seismic reflection data completed by the authors or provided externally by corporate sponsors. Earthquake hypocentral locations and orientations calculated from focal mechanism solutions, and the digital integration of all publicly available data, including maps, cross sections, existing fault interpretations, and interpretations from thousands of digital and raster well logs that were sourced from the RRC website (https://www.rrc.texas.gov/) and IHS LogNet (https://ihslognet.ihsenergy.com/).
The data sources, interpretation methods, and resulting fault confidences are listed in Table 1. Segments are classified according to levels of confidence: high, moderate, and low. High-confidence fault segments have enough data to validate their mapped geometry. Moderate-confidence fault segment interpretations have varying degrees of uncertainty about their present state that should be considered. These uncertainties may include their current mapped extent (length, height), geometry, lateral continuity, or specific placement. Faults that are classified as low confidence lack sufficient evidence based on our interpretation to warrant inclusion into the final fault map.
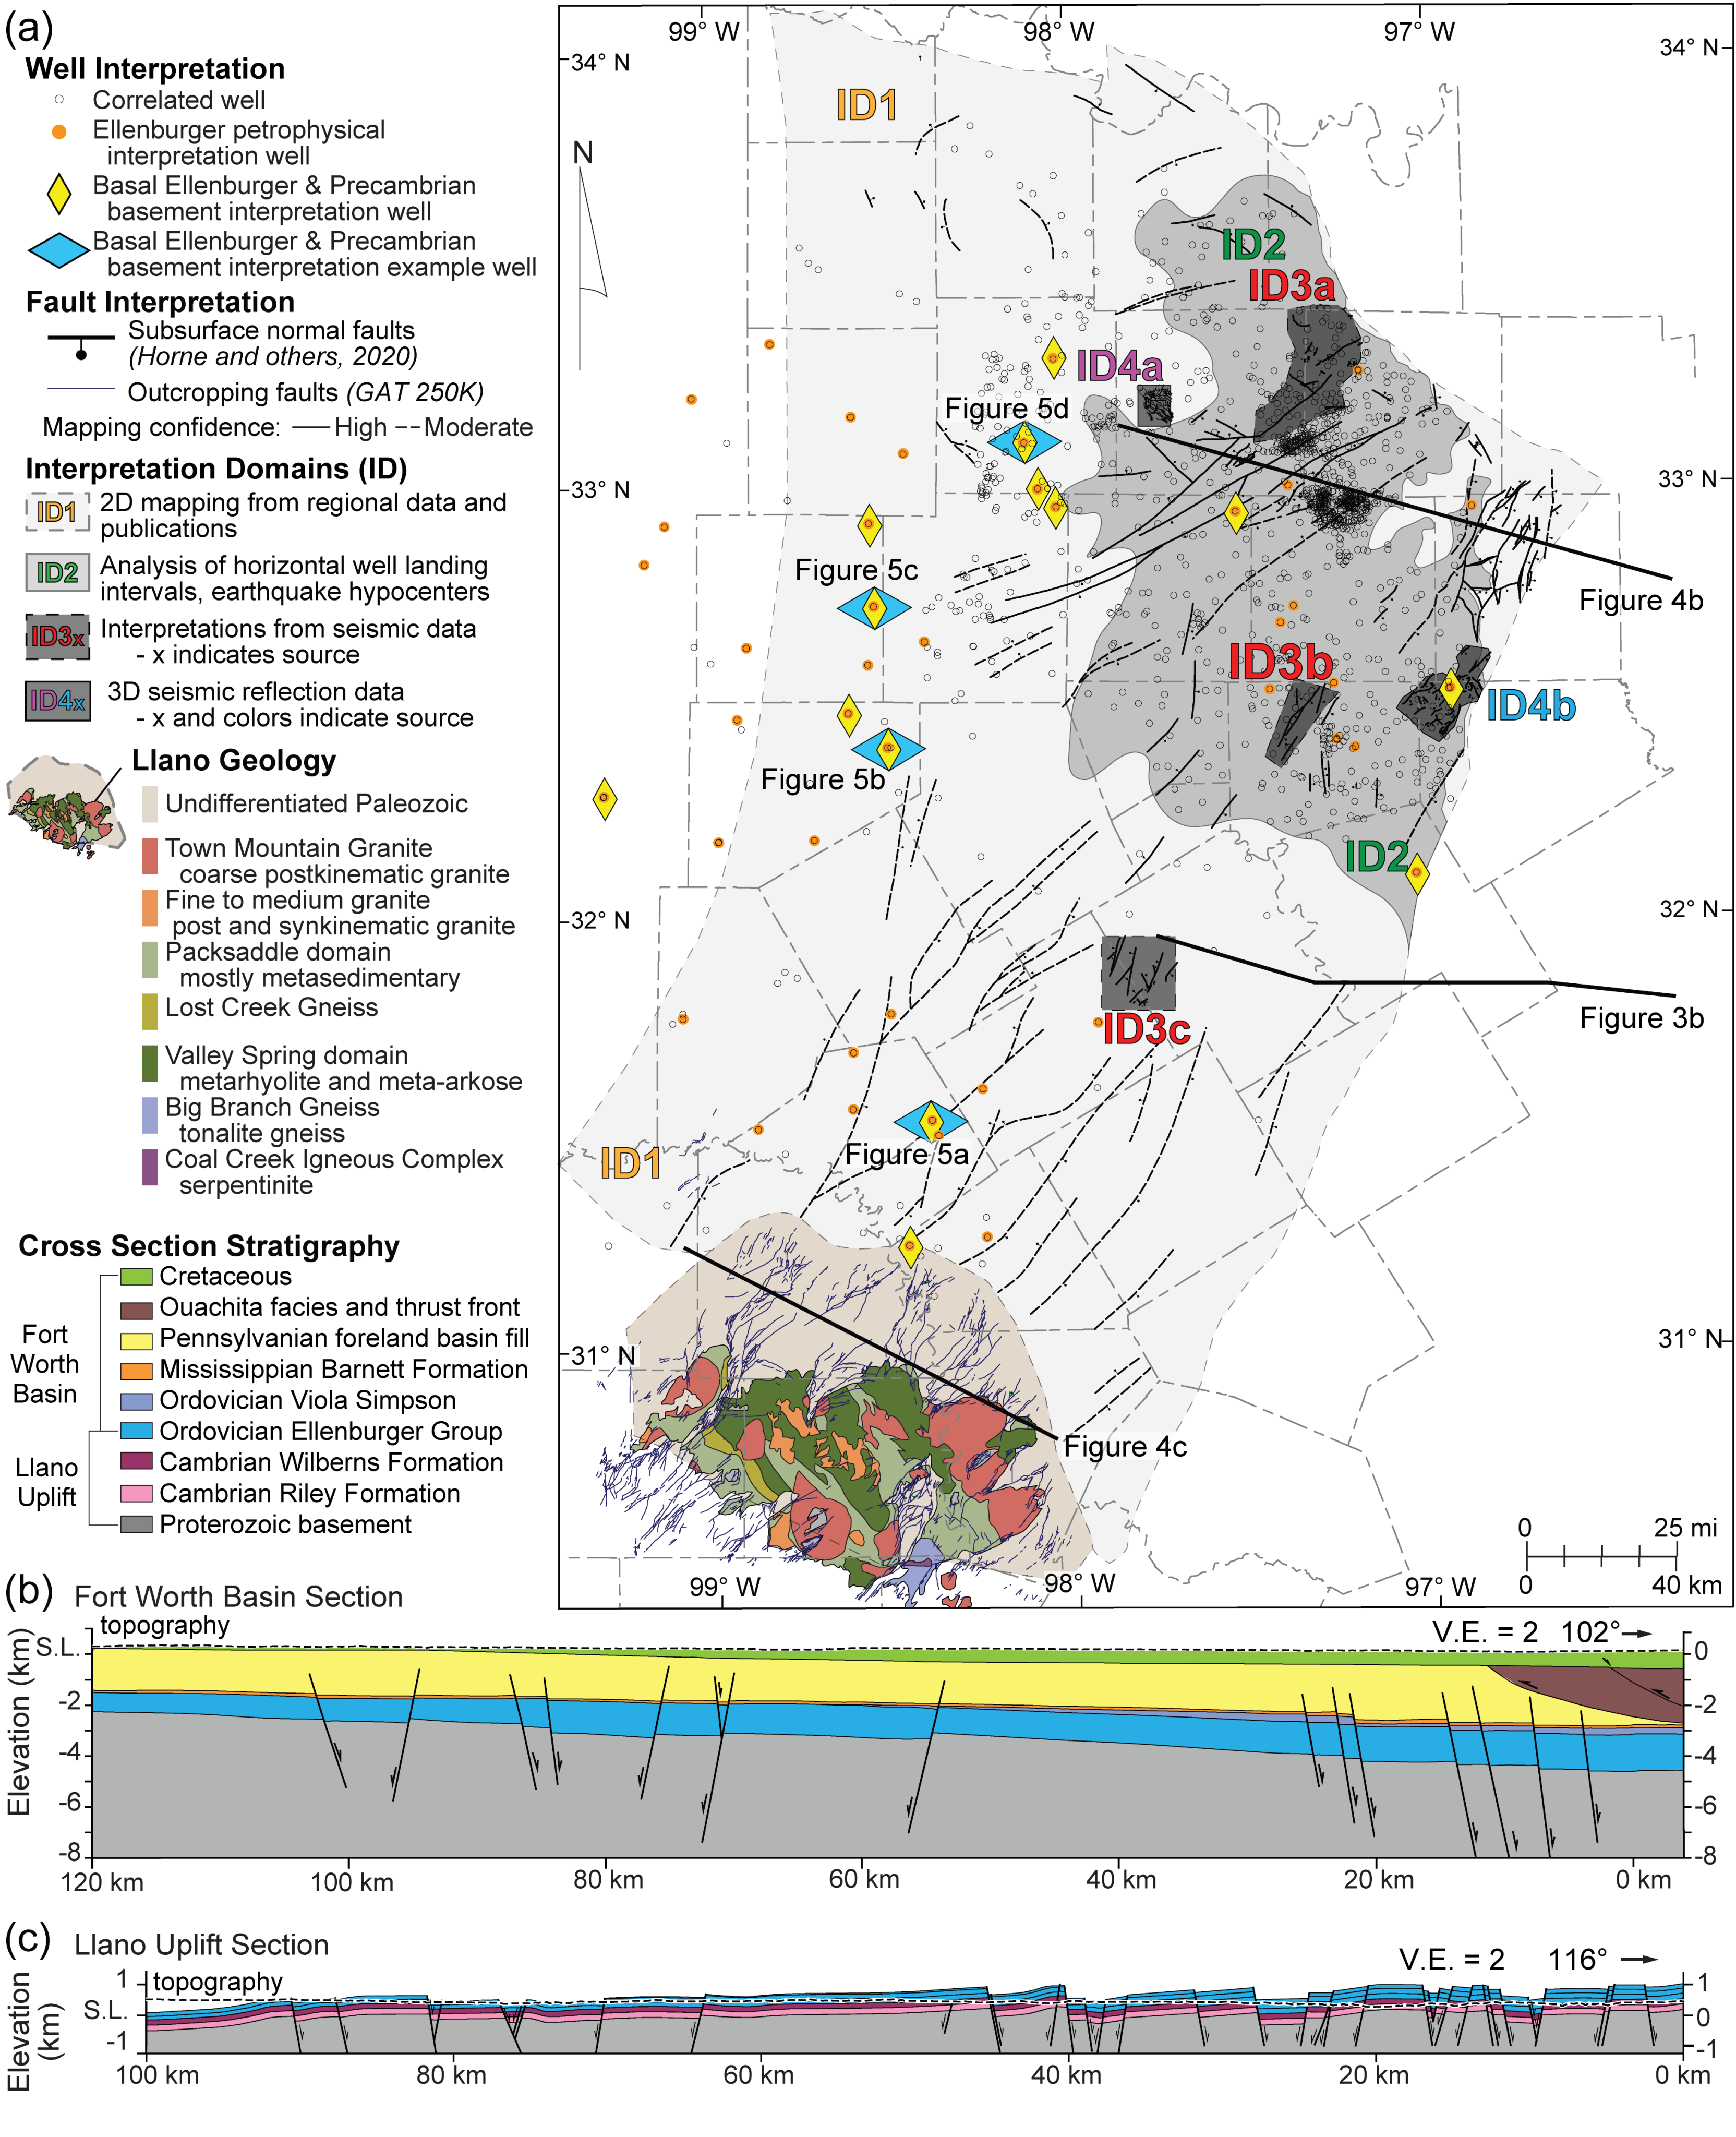
FWB2: (a) Index map of subsurface interpretation domains (ID1–4), used in Horne and others (2020) after Hennings and others (2019). Stratigraphic and petrophysical interpretations adapted from Smye and others (2019) are shown, including wells used in regional correlations (black circles). Wells used in petrophysical analysis of the Ellenburger Group (orange dots) and basal Ellenburger Group or Precambrian basement interpretation wells (yellow diamonds) are also shown. Blue diamond symbols represent the locations of Ellenburger Group or Precambrian basement example wells (fig. 5). Cross section traces for figures 3b, 4b, and 4c are shown. (b) Regional cross section of the Fort Worth Basin. (c) Regional cross section of the northern Llano Uplift. These cross sections illustrate changes in deformation across the northern and southern Fort Worth Basin. Figure and caption taken from Horne et al. (2022).
References
Fault interpretations
Horne, E.A., Hennings, P.H., Osmond, J.L., and Deshon, H.R., 2020, Structural characterization of potentially seismogenic faults in the Fort Worth Basin: Interpretation, v. 8, no. 2, p. T323–T347, https://doi.org/10.1190/INT-2019-0188.1.
Horne, E.A., Smye, K.M., and Hennings, P.H., 2022, Structure and characteristics of the basement in the Fort Worth Basin, in Callahan, O.A. and Eichhubl, P. eds., The Geologic Basement of Texas: A Volume in Honor of Peter T. Flawn: The University of Texas at Austin, Bureau of Economic Geology Report of Investigations No. 286, https://doi.org/10.23867/RI0286C7.
Mechanistic analyses & related work
Hennings, P.H., Nicot, J.P., Gao, R.S., DeShon, H.R., Lund Snee, J.E., Morris, A.P., Brudzinski, M.R., Horne, E.A., and Breton, C., 2021, Pore Pressure Threshold and Fault Slip Potential for Induced Earthquakes in the Dallas-Fort Worth Area of North Central Texas: Geophysical Research Letters, v. 48, no. 15, p. 32, https://doi.org/10.1029/2021GL093564.
Earthquake Catalog and 3D Fault Surfaces for Hennings et al., (2021) “Pore Pressure Threshold and Fault Slip Potential for Induced Earthquakes in the Dallas-Fort Worth Area of North Central Texas” are archived at the Texas Data Repository: https://doi.org/10.18738/T8/OBHYAS
Gao, S., Nicot, J.-P., Hennings, P.H., La Pointe, P., Smye, K.M., Horne, E.A., and Dommisse, R., 2021, Low pressure buildup with large disposal volumes of oil field water: A flow model of the Ellenburger Group, Fort Worth Basin, northcentral Texas: AAPG Bulletin, v. 105, no. 9, p. 2575–2593, https://doi.org/10.1306/03252120159.
Model inputs and other supplemental model data are archived at https://doi.org/10.18738/T8/CEQEDF.
Hennings, P.H., Lund Snee, J., Osmond, J.L., DeShon, H.R., Dommisse, R., Horne, E., Lemons, C., Zoback, M.D., Snee, J.E.L., Osmond, J.L., DeShon, H.R., Dommisse, R., Horne, E., Lemons, C., and others, 2019, Injection‐Induced Seismicity and Fault‐Slip Potential in the Fort Worth Basin, Texas: Bulletin of the Seismological Society of America, v. 109, no. 5, p. 1615–1634, https://doi.org/10.1785/0120190017.