
The fundamental properties of processed seismic data that are used to characterize reservoirs are temporal and spatial variations of reflection amplitude, reflection phase, wavelet frequency, and wavelet shape. Seismic-based structural and stratigraphic interpretations are made by analyzing areal patterns of these seismic attributes across selected seismic horizons. Any procedure that extracts and displays seismic amplitude, phase, frequency, or waveshape in a convenient, understandable format is an invaluable tool for reservoir characterization.
Taner and Sheriff (1977) and Taner et al. (1979) introduced the concept of using the Hilbert transform to calculate seismic amplitude, phase, and frequency instantaneously, meaning that a value of amplitude, phase, and frequency is calculated for each time sample of a seismic trace. Seismic interpretation has benefited greatly from this seismic-attribute technology because it allows the amplitude, phase, and frequency behavior of seismic data to be rigorously analyzed across targeted horizons. Numerous Hilbert transform algorithms have been implemented to calculate these useful seismic attributes (Click here for detailed information about the concept of the Hilbert transform).
BASIC CONCEPTS
Complex Seismic Trace
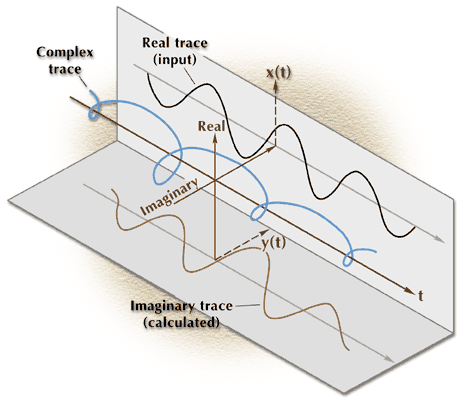
The concept of the complex seismic trace is illustrated in Figure 1, where x (t) represents the real seismic trace and y (t) is the Hilbert transform of x (t). In this module, we will ignore what a Hilbert transform is and how the function y (t) is calculated. Most modern seismic data-processing software packages and 3-D interpretation systems contain Hilbert transform algorithms and allow users to create the function y (t) shown in Figure 1.
The two data vectors x (t) and y (t) are displayed in a three-dimensional (x,y,t) space in this illustration, where t is seismic traveltime, x is the real data plane, and y is the imaginary plane. In this complex trace format, the actual seismic trace x (t) is confined to the real x-plane, and y (t), the Hilbert transform of x (t), is confined to the imaginary y-plane. When x (t) and y (t) are added vectorally, the result is a complex seismic trace z (t) in the shape of a helical spiral extending along, and centered about, the time axis t. The projection of this complex function z (t) onto the real plane is the real seismic trace x (t), and the projection of z (t) onto the imaginary plane is y (t), the calculated Hilbert transform of x (t).

Figure 1. A complex seismic trace. The seismic time axis is t. The real part x (t) of the complex trace is the actual seismic trace; the imaginary part y (t) is a mathematical function calculated from the real trace by a Hilbert transform process. When the real and imaginary traces are added in a vector sense, the result is a helical spiral centered about the seismic time axis. This helical trace is the complex seismic trace z (t).
Instantaneous Attributes
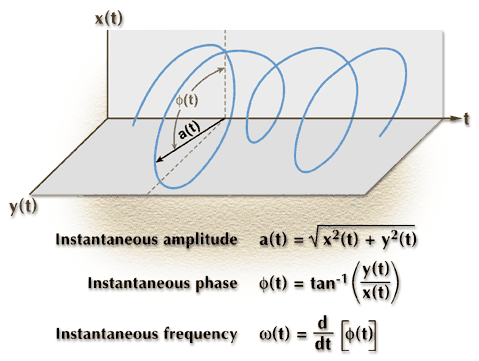
The reason for converting the real seismic trace x (t) into what appears to be a more mysterious complex seismic trace z (t) is illustrated in Figure 2, where the concepts of instantaneous seismic amplitude, phase, and frequency are introduced. At any point on the time axis, we can calculate a vector a (t) that extends away from the t axis in a perpendicular plane to intersect the helically shaped complex seismic trace z (t). The length of this vector is the amplitude of the complex trace at that particular instant: hence the term instantaneous amplitude. We mathematically calculate this amplitude value using the equation for a (t) shown in Figure 2.

Figure 2. The key seismic attributes — instantaneous amplitude a (t), instantaneous phase
(t), and instantaneous frequency (t) — which can be calculated once a complex seismic trace is created. The formulae used to calculate these attributes are defined below the complex trace.
The orientation angle
![]() (t)
of the amplitude vector a (t) at time t, which is generally measured relative
to the positive axis of the real x-plane, is defined as the phase of z (t)
at that moment in time: hence the term instantaneous
phase. Numerically, the phase angle is calculated from the equation
for
(t)
of the amplitude vector a (t) at time t, which is generally measured relative
to the positive axis of the real x-plane, is defined as the phase of z (t)
at that moment in time: hence the term instantaneous
phase. Numerically, the phase angle is calculated from the equation
for ![]() (t) defined in Figure
2. As seismic time progresses, vector a (t) not only moves along the t
axis, but it also rotates continually about the time axis to maintain contact
with the spiraling complex trace z (t). Each full rotation of the vector about
the time axis increases the phase value by 360 degrees.
(t) defined in Figure
2. As seismic time progresses, vector a (t) not only moves along the t
axis, but it also rotates continually about the time axis to maintain contact
with the spiraling complex trace z (t). Each full rotation of the vector about
the time axis increases the phase value by 360 degrees.
In any oscillating system
and specifically for a seismic trace that oscillates between positive values
(peaks) and negative values (troughs), frequency can be defined as the time
rate of change of the phase angle. This fundamental definition describes the
frequency of the complex seismic trace, allowing the instantaneous
frequency (t) at any seismic time sample to be given by the time derivative
of the phase function ![]() (t)
at that time sample as is specified by the bottom equation in Figure
2.
(t)
at that time sample as is specified by the bottom equation in Figure
2.
 |
 |
| ©1999 AGI |