 |
 |
| ©1999 AGI |

Upper Caddo net reservoir sandstone thickness as defined by well log control. This map is a computer-contoured product generated from 40 (approximately) control wells. Note the series of bullseyes centered on the BYTS 14, 8, 9, and DUNCN 3 wells, suggesting that an elongate valley-fill sandstone extends southwestward from the main valley-fill complex in the northern part of the 3-D survey.
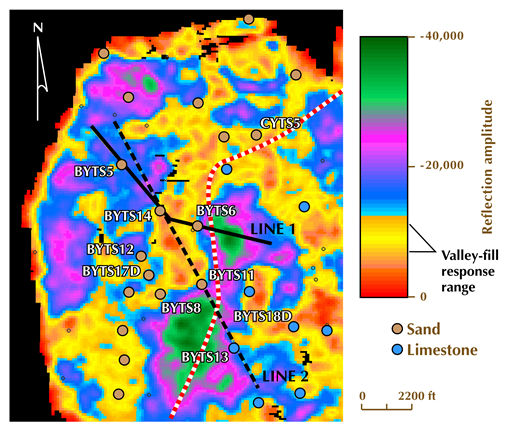
This is a map of a seismic amplitude attribute calculated within the Upper Caddo sequence. The parameter that is displayed is the average of the negative reflection amplitudes occurring in a 30-ms window immediately below the Caddo sequence boundary (MFS 90). The amplitude values coinciding with the low-amplitude, yellow and red portions of the color bar define a southwest-northeast trend that is remarkably similar to the valley-fill trend shown by the contours in the figure above. Wells east of the dotted line were not used in the seismic attribute calibration; consequently the range of the attribute that is sensitive to the presence of reservoir facies (the low-amplitude yellows and reds) produces a north-south trend that is erroneous. This latter trend maps a distribution of unproductive thin limestones that create a low-amplitude destructive interference, not a reservoir sandstone facies trend. The color code used for the well symbols defines the type of rock facies that dominates the Upper Caddo sequence seismic response.
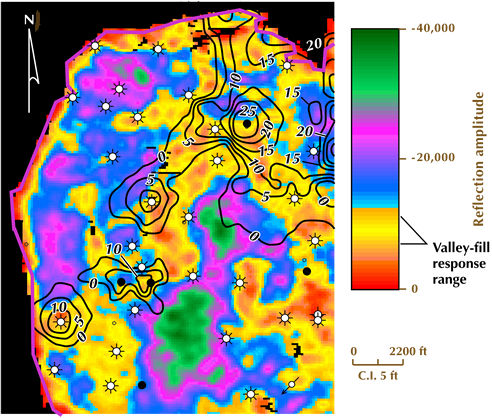
Here the computer-contoured net-sandstone thickness map is superimposed onto of the seismic amplitude map. The valley-fill trend shown by the contours coincides with amplitude values denoted by the low-amplitude, yellow and red portions of the color bar, defining a southwest-northeast trend.
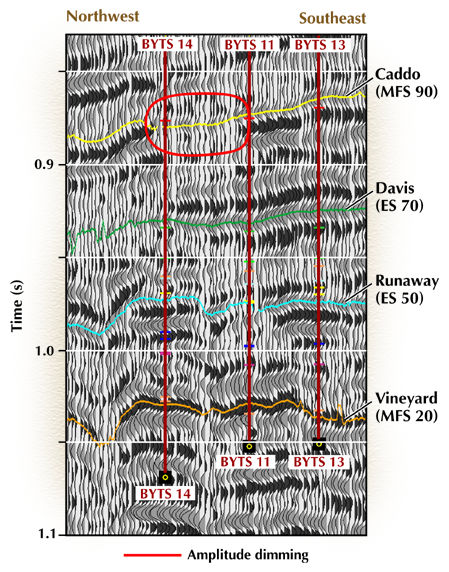
Seismic response along Line 2 defined in the second figure on this page. The Caddo surface shown in that same figure is the yellow horizon at the top of this figure. The amplitude dimming associated with the sandstone fill in the incised valley trend is circled in red.
![]()