 |
 |
| ©1999 AGI |

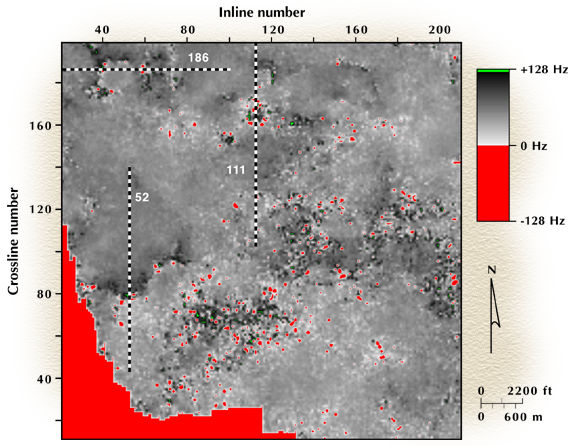
Time slice cutting through a 3-D instantaneous frequency volume at a two-way time of 900 ms. The color bar emphasizes anomalous frequencies (that is, negative frequencies and frequencies having extreme positive values). The seismic profiles that follow illustrate how narrow continuous trends of these anomalous instantaneous frequency values define structural and stratigraphic discontinuities, some of which are extremely subtle.

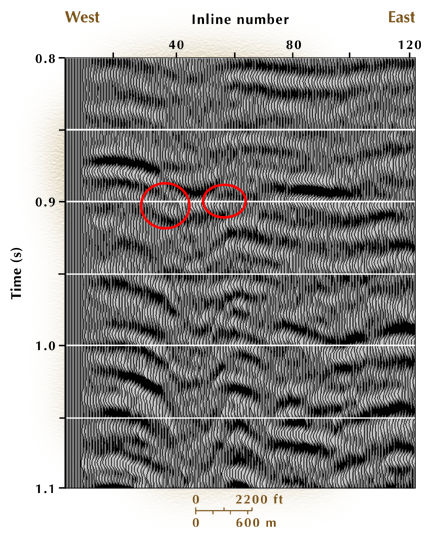
Inline profile 52 showing that the narrow meandering east-west trend of anomalous instantaneous frequency values that occur near crossline coordinate 80 in the 900-ms time slice in the figure above are associated with a stratigraphic pinch-out. On this profile, these anomalous frequencies occur at 900 ms near the center of the circled area.
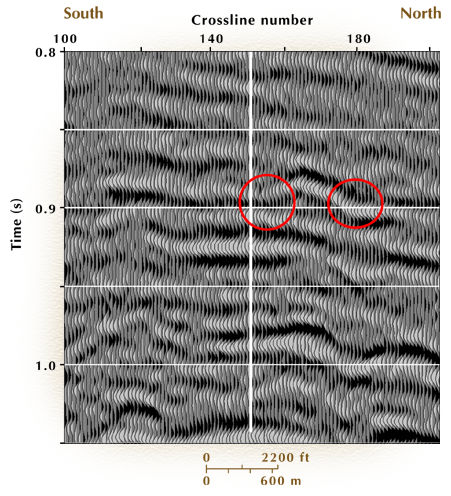
Inline profile 11, which crosses a ring of anomalous instantaneous frequency values that can be seen near crossline coordinate 170 in the 900-ms time slice in the figure at the top of this page. On this profile, these anomalous frequencies occur at 900 ms near the centers of the two circled areas. The circular feature defined by these anomalous frequencies is a carbonate buildup.
Crossline 186 showing a section view of the ring of anomalous instantaneous frequency values that occur near inline coordinate 50 in the 900-ms time slice in the figure at the top of the page. On this profile, these anomalous frequencies occur at 900 ms near the centers of the two circled areas. In this instance, the anomalous frequencies define the boundary of a deep, vertically oriented, karst collapse zone.
![]()