 |
 |
| ©2000 AGI |

A map of the study area is shown below in Figure 1. The solid dots show production wells, many drilled at 40-acre spacing. The circled dots locate wells where geologic and engineering control was acquired in the form of modern logs, cores, or pressure tests. The 3-D seismic area is approximately 7.6-mi2. VSP control data were recorded in two closely spaced wells, 175 and 202, inside the triangle near the center of the 3-D seismic grid. The pressure interference test data that will be analyzed were recorded between these same two wells.
Figure 1. Map of the study area. The solid dots show production wells, many drilled at 40-acre spacing. The circled dots locate wells where additional geologic and engineering control was acquired in the form of modern logs, cores, or pressure tests. The 3-D seismic area is approximately 7.6-mi2. VSP control data were recorded in two closely spaced wells, 175 and 202, inside the triangle near the center of the 3-D seismic grid. The pressure interference test was done between these same two wells.
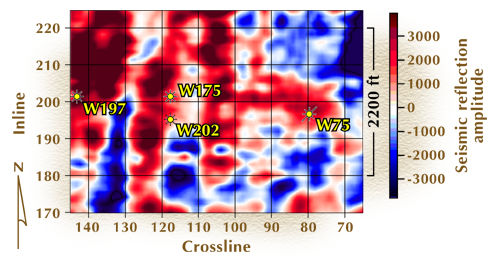
Figure 2 (below) is a horizon slice through the 3-D seismic data volume that cuts through a targeted thin-bed reservoir system.
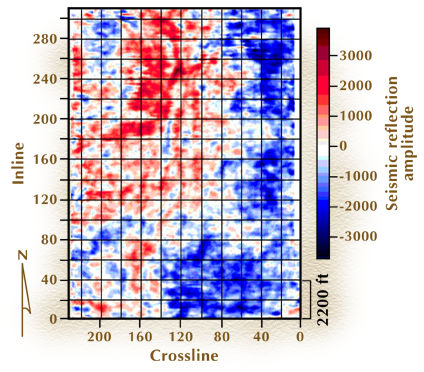
Figure 2. Static reservoir pressures measured during a 1-month period in the four wells shown in Figure 5. The bottom-hole pressure in well 75 was 300 psi at abandonment. The different reservoir pressure at these four well locations suggests that each well may be in a different reservoir compartment.
Figure 3. Stratigraphic cross section of the reservoir along the 4-well profile showing the depositional environments interpreted from log shapes and the initial bottom-hole pressure (BHP) observed in each well. The date when each well was drilled is shown above the BHP value. The log depths are measured from KB and the curves are shifted to align on a stratigraphic datum. The log curves infer that the reservoir in each well was deposited in a channel environment that shows some evidence of splay deposition. These log data, by themselves, do not provide enough information to define where compartment boundaries may exist.
![]()