 |
 |
| ©2000 AGI |


Figure 4. Seismic reflection amplitude behavior on a stratal time surface through the reservoir interval penetrated by the four wells. The seismic image indicates some possible compartment boundaries. For example, a likely cause of the compartment boundary that separates well 197 from the other wells is the depositional variation that creates the red/blue (positive/negative) amplitude changes that trend north-south between crossline coordinates 130 and 140. Similarly, a probable seismic indication of the compartment boundary that segregates well 75 from the other wells is the positive-to-negative (red-to-blue) amplitude variations trending north-south between crossline coordinates 110 and 120. However, this same logic of looking for interwell reflection amplitude changes does not explain why there is a compartment boundary between wells 175 and 202, which are only 200 ft (61 m) apart. There is no appreciable change in the reflection phase between these two wells (i.e., there is no color change in the reflection amplitude plot between wells 175 and 202).
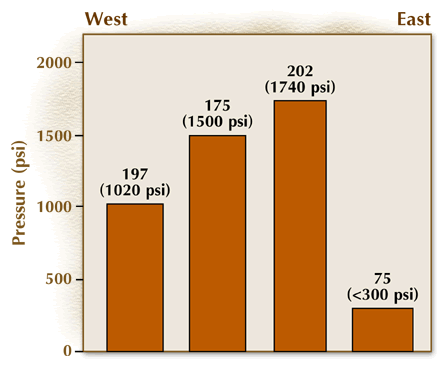
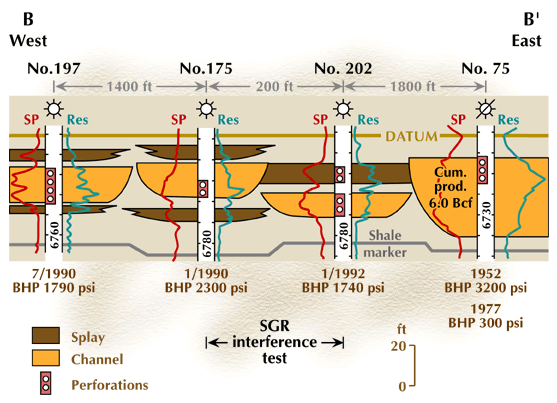
A stratigraphic cross section of the thin-bed reservoir along the 4-well profile that shows the depositional environments interpreted from log shapes and the initial bottom-hole pressure (BHP) observed in each well is illustrated in Figure 5 below. The date when each well was drilled is labeled above the BHP value. The log depths are measured from the well’s kelly bushing (KB), and the curves are shifted to align on a stratigraphic datum. The log curves infer that the reservoir in each well was deposited in a channel environment that shows some evidence of splay deposition. These log data, by themselves, do not provide enough information to define where compartment boundaries may exist.

Figure 5. Stratigraphic cross section of thin-bed reservoirs along a 4-well profile.
The seismic reflection amplitude behavior on a stratal time surface through the reservoir interval penetrated by the four wells is helpful in developing a reservoir compartmentalization model. The seismic image (Fig. 3) indicates some possible compartment boundaries. For example, a likely cause of the compartment boundary that separates well 197 from the other wells is the depositional variation that creates the red/blue (positive/negative) amplitude changes that trend north-south between crossline coordinates 130 and 140. Similarly, a probable seismic indication of the compartment boundary that segregates well 75 from the other wells is the positive-to-negative (red-to-blue) amplitude variations trending north-south between crossline coordinates 110 and 120. However, this same logic of looking for interwell reflection amplitude changes does not explain why there is a compartment boundary between wells 175 and 202, which are only 200 ft (61 m) apart. There is no appreciable change in the reflection phase between these two wells (i.e., there is no color change in the reflection amplitude plot between wells 175 and 202).
Our objective is to do a pressure interference test between wells 175 and 202 to determine if they are connected in a fluid flow sense, or if there is a compartment boundary in the interwell space that prevents horizontal fluid flow.