 |
 |
| ©1999 AGI |


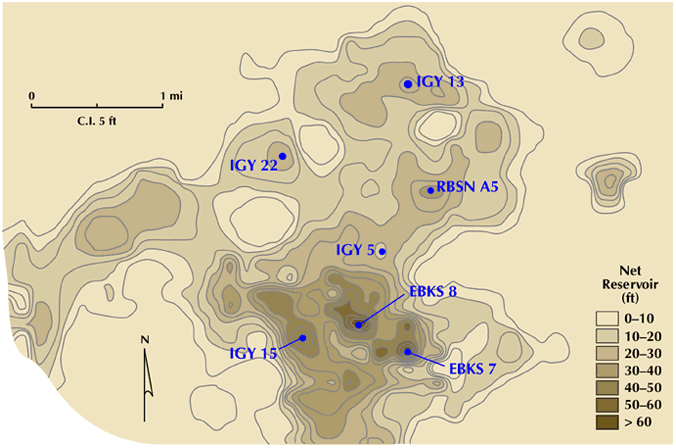
Lower Caddo net reservoir sandstone as determined from well log control, using the criteria that Lower Caddo reservoir facies exist whenever the resistivity exceeds 10 ohm-m and simultaneously when the normalized SP curve reads less than -30mV. This map was created using data from approximately 75 wells within the map area; only 8 of the wells are labeled. The thick sandstone trend aligned northeast-southwest between the IGY 15 and RBSN A5 wells is a strike-oriented delta-front deposit; the northern trend passing through the IGY 13 and 22 wells is probably a system of distributary channels.

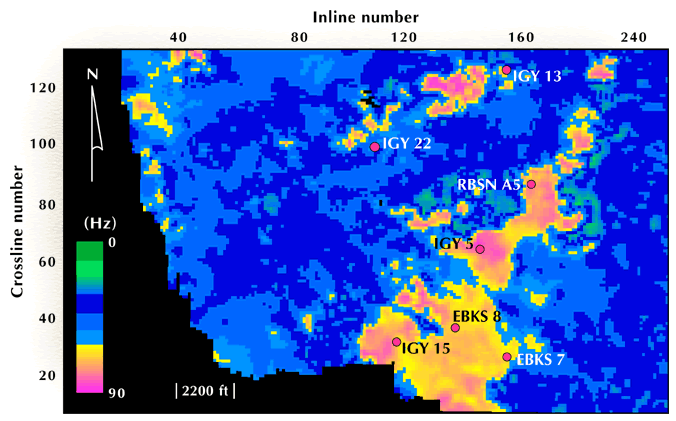
Average instantaneous seismic frequency calculated within the Lower Caddo sequence. The correspondence between this seismic attribute map and the log-based net reservoir map above is striking, and shows that, in this circumstance, 3-D seismic data provide a valuable predictive tool (that is instantaneous frequency) for locating stratigraphically trapped reservoirs. Note that the frequency range that depicts the presence of the reservoir facies is 70 to 80 Hz, which infers that the seismic data used to analyze these low-accommodation sequences must have a broad signal bandwidth.
Click button to the right to overlay contours 