
Inspection of Figure 4 shows two important features of instantaneous amplitude:
Some physical interpretations of the complex seismic trace and its associated instantaneous amplitude that have been proposed are:
Viewing the instantaneous-amplitude function this way explains why it can differ from the amplitude of the real seismic trace and yet be a valid and meaningful estimate of the amplitude associated with a seismic reflection response.
Instantaneous Phase
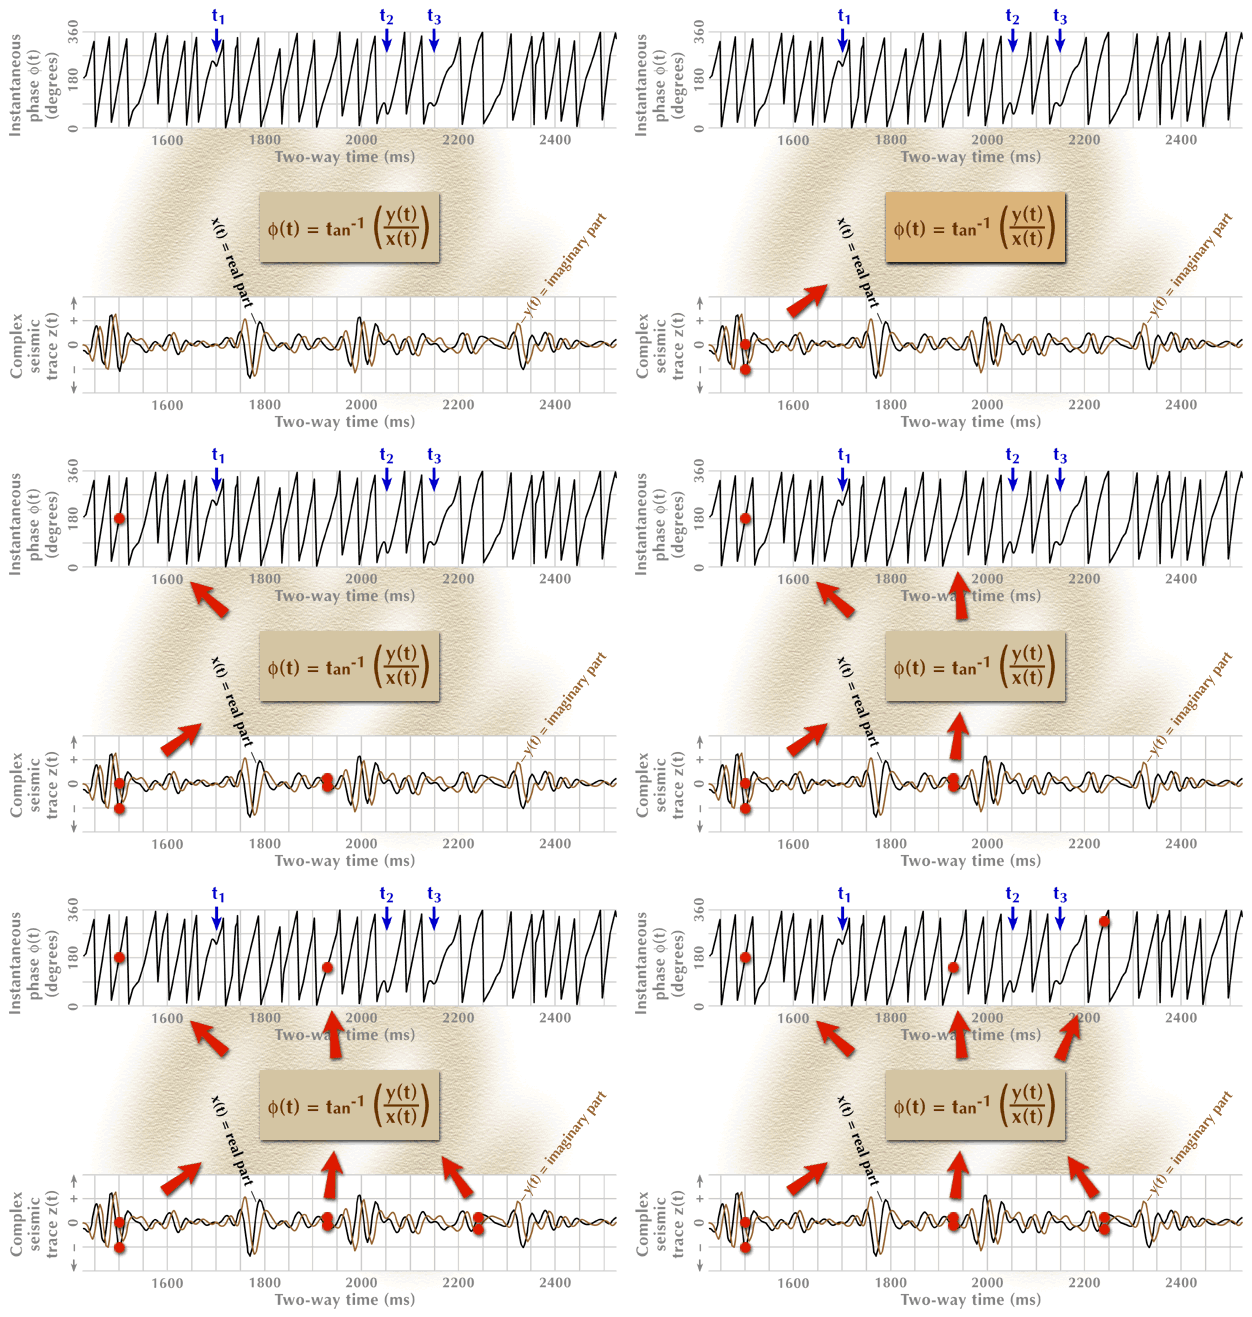
Calculation of the instantaneous phase associated with a typical seismic trace is illustrated in Figure 5. The bottom panel in the figure shows the real and imaginary components of the complex trace.

Figure 5. The instantaneous-phase seismic attribute function. The real and imaginary components of the complex seismic trace from Figure 4 are shown in the bottom panel, and the calculated instantaneous phase is shown in the top panel. The phase behavior at times t1, t2, t3 (top panel), critical to the understanding of anomalous frequency behavior, is explained in the text.
The animation sequence starts with the input data for the process (bottom), proceeds through an action step (center box), and then produces the required output function (top). Only three data points are processed through the action-step box.
Applying the equation for instantaneous phase to the real and imaginary components of the complex seismic trace produces the instantaneous-phase function at the top of the figure. Although phase is a positive function that increases monotonically in magnitude with time, it is customarily plotted as a repetitive, wraparound function having plot limits of 0° to 360° (or 180° to +180°). Each wraparound of 360° corresponds to a full rotation of the a (t) vector about the time axis as that vector stays in contact with the spiraling complex seismic trace z (t) (refer to Fig. 2).
 |
 |
| ©1999 AGI |