To
characterize flow through the reservoir, a representative 2,000-acre
(Figure 2) area of the field was chosen for detailed characterization,
modeling, and simulation on the basis of the availability of cores
and modern wireline log suites.
The following
steps were taken to construct the reservoir model:
- Construction
of a cycle-based reservoir framework based on facies- and cycle-stacking
patterns defined from outcrops and subsurface cores and their
correlation throughout the area using calibrated wireline logs.
This framework forms the basic architecture for the model.
- Calculation
of porosity from wireline logs using petrophysical relationships
derived from integrated core and wireline logs.
- Calculation
of permeability from wireline-log porosity based on rock-fabric
porosity /permeability interrelationships.
- Delineation
of flow layers based on reservoir framework and calculated permeability
distribution.
- Calculation
of original oil saturation from rock-fabric-based capillary pressure
modeling.
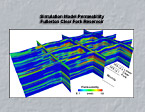
- Construction
of fine-scale geological model (Figure 14) containing 3.2 million
cells (140×90×256) was based on rock-fabric flow layers.
- Upscaling
of fine-scale model to coarse reservoir model containing 135,000
cells (73×48×39) for reservoir simulation.
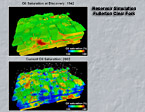
The simulation
study is divided into three phases: (1) sensitivity study, (2) history
matching, and (3) performance prediction. From the sensitivity study
we are ranking the importance of reservoir parameters affecting
production performance. Through history matching, optimal fluid
and rock properties are being determined, such as initial oil saturation
and current oil saturation (Figure 15). In the prediction phase,
a variety of recovery technologies for maximizing oil recovery are
being analyzed. |