|

|
| ©2000 AGI |

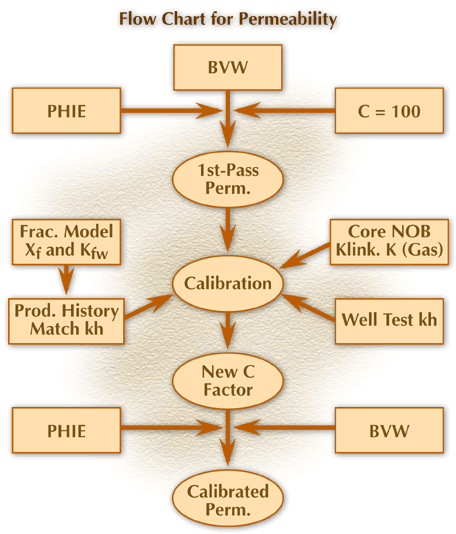
The flow chart below (figure 4) shows the process for calculating permeability. By taking the calculated BVW and Fe data, it is possible to calculate a first-pass permeability estimate, then calibrate this estimate to real-world data to obtain a calibrated permeability.

FIGURE 4