|

|
| ©2000 AGI |

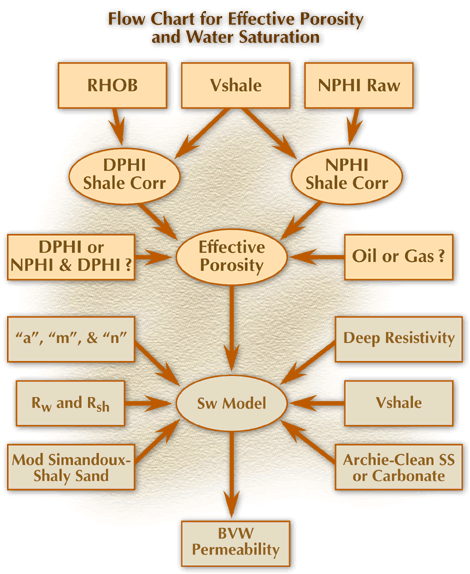
The following flow chart (figure 3) demonstrates the method for arriving at effective porosity and water saturation, correcting porosity inputs for clay volume. Subsequent steps show considerations for calculating Sw from porosity, Vshale, and resistivity inputs, and estimating permeability.
FIGURE 3
