 |
 |
| ©2000 AGI |

Interpreting Field Data
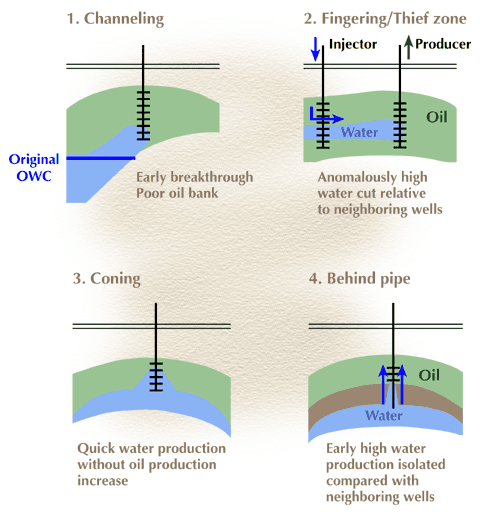
Determining the movement of water into an oil or gas reservoir characterizes the aquifer/hydrocarbon reservoir interaction and aids in reservoir development. Modeling the direction of encroachment is best accomplished by analyzing water/gas ratios (WGR), reservoir pressure, oil–water cut (percent water), downhole production logging-tool response (spinner tests), and produced-water characteristics in a time series of maps. This analysis is dependent on monitoring data at short time intervals so that significant trends can be observed. Map time-series observation facilitates determination of fluid movement in three dimensions and integration of geology and engineering, and it aids in reservoir simulation. Increases in WGR can occur as a result of four different scenarios: (1) water coning or fingering, (2) reservoir communication with a small passive aquifer, (3) reservoir communication with a strong aquifer, and (4) communication with a water zone behind casing. Figure 3 (below) demonstrates these concepts.

Figure 3. Vertical water-production scenarios.
An increasing water:hydrocarbon ratio (WHR) is the first phenomenon signifying a water-production problem and possible aquifer encroachment. At the onset of increasing WHR, the possibility that water coning or fingering is occurring in a single well must be suspected. Either of these occurs when a well bore pressure drawdown is high enough to cause a local change in the hydrocarbon–water contact (HWC) such that it comes in contact with the well bore. Reservoirs that have good permeability and/or high permeability heterogeneity are most susceptible to coning and fingering. Diagnostic features of coning or fingering include rapidly increasing WHR or WHR increasing in only one well while others at structurally equivalent positions show no WHR increase (water crosscutting structure). This crosscutting of structure can occur in multiple wells. Coning or fingering may occur when WHR increases rapidly immediately after drawdown on a well has been increased. In some cases, production logging tools can identify whether water is coming from the lowest perforations. A time series of WGR or WOR maps will show a rapid increase in WGR or WOR in localized spots (like bull’s-eyes). Over time, WHR will increase in those wells that have coning or fingering problems.
WHR can also increase when a passive or small aquifer is connected to a reservoir (no water drive or only a weak one). In this scenario, a steady WHR increase will occur with a large drop in overall reservoir pressure over an extended period. Aquifer encroachment will gradually follow up structure, with the hydrocarbon–water contact rising on a reservoir scale. Local variation in permeability may cause faster localized WHR changes; however, it is unlikely that water encroachment will crosscut structure significantly.
A strong water-drive aquifer can cause the WHR to increase early in the production life of a reservoir. Encroachment of water will follow up structure, increasing the WHR over time, corresponding to overall reservoir pressure drop and cumulative hydrocarbon production.
The final scenario that can increase WHR is communication with a water zone behind casing. Water problems occur when poor casing cementation permits water to move between casing and formation. If a water-behind-casing problem results from a poor cement job, the initial WHR may be high and the well may appear to have been completed in the hydrocarbon/water transition zone. When the cement job deteriorates over time, WHR may increase slowly. Water-behind-casing problems can be diagnosed when increasing WHR does not correspond to reservoir cumulative production or pressure changes or when the problem is localized and as a result does not occur in other nearby wells.
Monitoring and analyzing reservoir pressure can determine whether water problems are related to one of the four scenarios described earlier and can indicate direction of water influx. Aquifer encroachment causes the rate of pressure depletion to decrease over time with increasing cumulative production. Neither coning and/or fingering nor increased WHR from water behind casing will provide pressure support. A passive aquifer will provide little pressure support.
By mapping and interpreting material-balance plots in gas reservoirs, the area for which pressure support is occurring can be determined. Figure 1 illustrates the effect different reservoir characteristics have on material-balance plots. Strong evidence of pressure support is provided when the pressure support corresponds to rapid increases in WHR up structure. The direction of increasing WHR and pressure support illustrates the direction of water encroachment.
Production logging tools (spinners) can also assist in determining the characteristics of water production. These tools demonstrate what water volume, different perforations, and/or sandstone zones contribute to total water production. When water is coming almost exclusively from upper perforations, communication with a water zone behind the casing should be suspected; when only the lowest perforations are contributing to water production, however, coning or fingering should be suspected. A specific reservoir sandstone connected to an aquifer may be isolated in the case of multiple sandstone zones. Information gained from production logging tools can guide the use of dual completions, permeability profile modification, and/or selective perforation plugging.
Monitoring produced-water chemistry can indicate the origin of water and thus aid in determining water fluid-flow trends. Changing water chemistry should be analyzed over time and between wells. Freshening of produced water may indicate communication with a water zone behind the casing above the reservoir (water dumping), whereas increasing salinity may indicate production from an aquifer that is more saline than the connate water. Proper interpretation can be accomplished only when the specific reservoir water chemistry (as well as that of the overlying and underlying aquifers) is known.