 |
 |
| ©2000 AGI |

Analysis of Pressure History
Pressure data can be valuable information in characterizing a reservoir for determining fluid flow compartments. Pressure data are normally obtained from downhole measurement and/or measurement at the wellhead. The pressure measurement desired is the reservoir pressure surrounding the well bore. There are several difficulties to obtaining an actual reservoir pressure. The well must be shut-in a sufficient length of time for the pressure to stabilize so that the measurement does not reflect a transient state. Wells nearby, if not also shut-in, may cause interference from their drawdown, resulting in a measured pressure lower than the actual reservoir pressure. If the well bore is open to more than one production zone the measured pressure may reflect only the most permeable zone. Additionally, if the reservoir pressure has been determined from shut-in wellhead measurements, unknown liquid loading in the well bore may cause the calculated reservoir pressure to be less than the actual pressure.
One method of analyzing pressure history is through the concept of material balance. This concept states that in a closed system the moles of hydrocarbons produced must equal the initial moles of hydrocarbons minus the remaining moles (Beggs, 1984). This concept is readily used in the analysis of gas reservoirs where pressure data are periodically measured. When the gas law is applied to this concept it results in the linear equation below, where the x value is Gp and the y value is P/Z. Note that when P/Z (y value) equals zero then Gp/G is equal to one. Therefore, a linear extrapolation of a P/Z vs Gp plot (material-balance plot) to a value of P/Z equal to zero results in obtaining the original gas in place (G).
|
P/Z = -[Pi/(ZiG)]Gp + Pi/ZI , where P = pressure Z = gas-compressibility factor I = initial oil in place G= original gas in place Gp = cumulative gas produced |
Gas-material-balance plots, if correctly interpreted, can give valuable information about reservoir character and fluid flow. Characteristics are interpreted from the shape of the material balance plot.
 |
|
|
 |
|
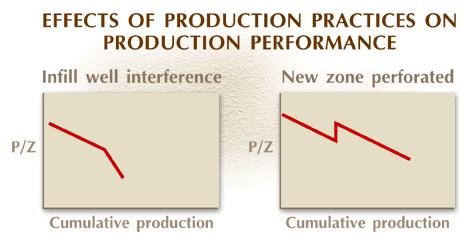
Changes in the gas-material-balance plots can occur from two sources. The first source is the effect that reservoir-production practices can have on the material-balance plot. For example, a new well drilled in a gas field can change the drainage pattern of the existing well causing "interference," which can reduce the effective drainage area of the existing wells. This interference will cause the slope of the line on the material-balance plot to decrease, reflecting the reduced effective-drainage volume. Perforating a new zone can result in an abrupt increase in the material-balance plot as the pressure from the newly perforated zone increases the overall pressure.
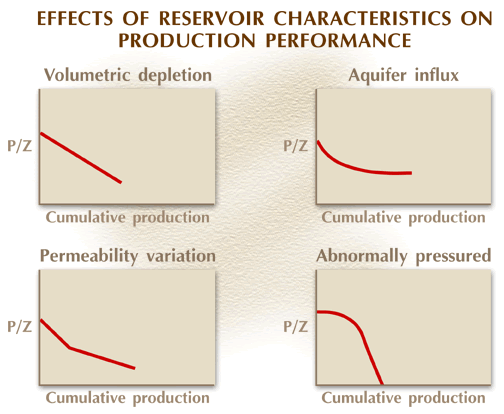
Reservoir characteristics are the second control on change in the gas-material-balance plots. The volumetric depletion of a single reservoir compartment results in a straight line that can be extrapolated down to 0 P/z to determine the original gas in place. If, however, a well is perforated in multiple zones that contain highly variable permeability, the resulting material-balance plot will likely not be straight. The more-permeable zones will deplete first, followed by the less-permeable zones, resulting in kinks on the line. The initial drive mechanism also affects the material-balance plot. An aquifer drive will give pressure support to the reservoir, causing the material-balance plot to curve and flatten out at the pressure-support value. Abnormally high pressure (geopressure) can cause the material-balance plot to not decline as the expansion of the sediments occurs, followed by a rapid decline reflecting the depletion of the compartment.