 |
 |
| ©2000 AGI |

AMPLITUDE AND TIME-THICKNESS CROSSPLOTS
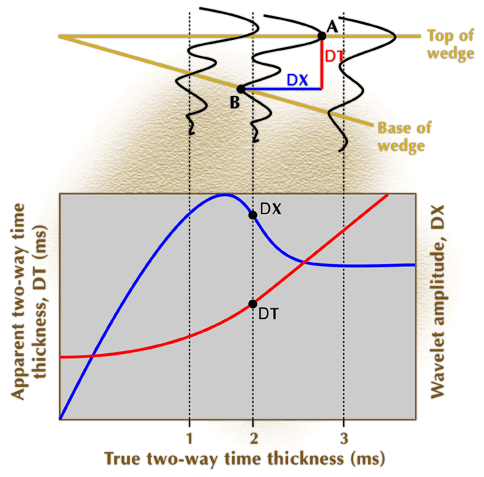
A common procedure used to interpret and calibrate the thickness of thin beds from seismic data is to construct an amplitude-versus-time-thickness crossplot from synthetic reflection waveforms that are constructed in the manner shown in the wedge-model exercise. In such crossplots, the amplitude axis is some arbitrary measurement of the amplitude of the reflection waveform associated with the thin bed (such as a peak amplitude, a trough amplitude, or a peak-to-trough amplitude) DELTA X symbol, and the time-thickness axis refers to the time difference between the extrema of the peak and trough that mark the top and bottom reflections of the thin bed DELTA T symbol. An example of the construction of such a calibration graph is shown in Figure 5.
The model responses (top) are the same data created in the wedge model exercise.
