 |
 |
| ©2000 AGI |

WEDGE MODEL
Calculating seismic reflection responses across a bed that thins continuously is a useful modeling technique for developing the principles of thin-bed interpretation that will be emphasized in this module. Such a wedge model is displayed below.
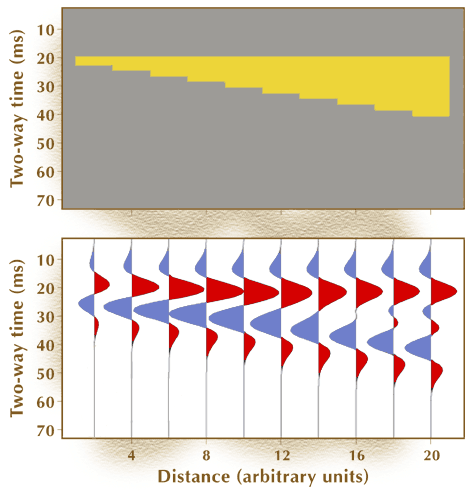
Figure 3.
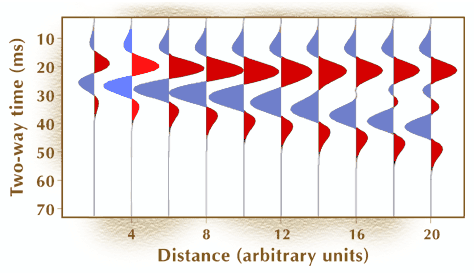
In this model, the media above and below the thin bed have the same acoustic impedance, which causes the reflection coefficients at the top and bottom of the bed to have the same magnitudes but opposite algebraic signs. The basic features of the composite reflection generated by this simple model can be used to illustrate how bed thickness affects seismic reflection character for most thin-bed depositional systems. The physics of the reflection process is shown by the animation below
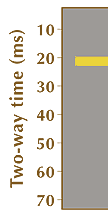
| Note the seismic reflection from top of the bed in red, also known as the postive coefficient from surface. As sound travels through the bed a seismic reflection from the base is generated, which has the same magnitude as the first reflection, but the opposite algebraic sign. Note this reflection from base, or negative coefficient from surface in blue. At this point the two wavelets exist as seperate but overlapping waveforms. | ||
 |
 |
|
|
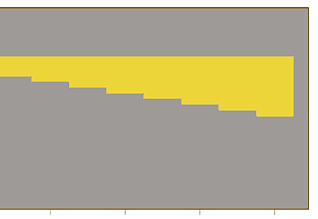
The two wavelets are then added together...
|
|
to create the composite
response in the wedge model below.
|
 |

When the one-way time thickness of the wedge is one-half or more the dominant wavelength, the amplitude of the reflection event does not change in magnitude. For such thick beds, the embedded animation shows that the only indication that bed thickness decreases (increases) as the modeling process moves across the wedge is that the timing difference between the reflections from the top and base of the bed decreases (increases).
![]()