 |
 |
| ©2000 AGI |

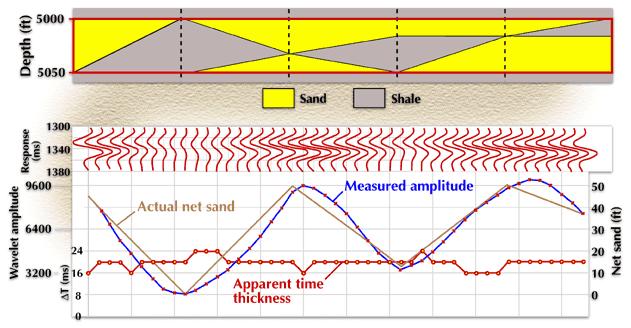
The bed thickness at which the amplitude of the reflected composite waveform is a maximum in an amplitude-versus-time thickness crossplot is referred to as the tuning thickness. The actual time thickness of the layer that was used when calculating each synthetic reflection waveform is plotted on the horizontal axis of this plot and is labeled two-way true thickness.The principal features of such calibration charts are
1. There is a linear relationship between the apparent (measured) two-way time thickness of a bed and its actual two-way time thickness when the bed thickness is more than tuning thickness, which in this model is 16 ms. This relationship is shown by the quasi-linear, heavier dashed line that slopes up to the right from a thickness value of 16 ms. In this thickness range above one-half the dominant wavelength (in two-way time), a bed is said to be time resolved, and its actual thickness can be determined from its apparent (measured) two-way time thickness.
2. There is a quasi-linear relationship between the peak-to-trough amplitude curve and the actual bed thickness when the two-way bed thickness is less than tuning thickness. Beds in this thickness range exhibit the same apparent (measured) time thickness, regardless of their actual thickness. This effect is shown by the flat, horizontal portion of the measured time-thickness curve. If reflection events from such beds can be seen in seismic data, the beds are said to be detected not resolved, and their actual thicknesses must be estimated from the linear relationship between the actual bed thickness and the peak-to-trough amplitude of the reflection composite.
The particular calibration chart shown in Figure 5 is correct only if the basic wavelet that is contained in the seismic data that are being interpreted can be represented by a 20-Hz Ricker wavelet. A different calibration chart must be constructed for any other type of wavelet.

Figure 5.