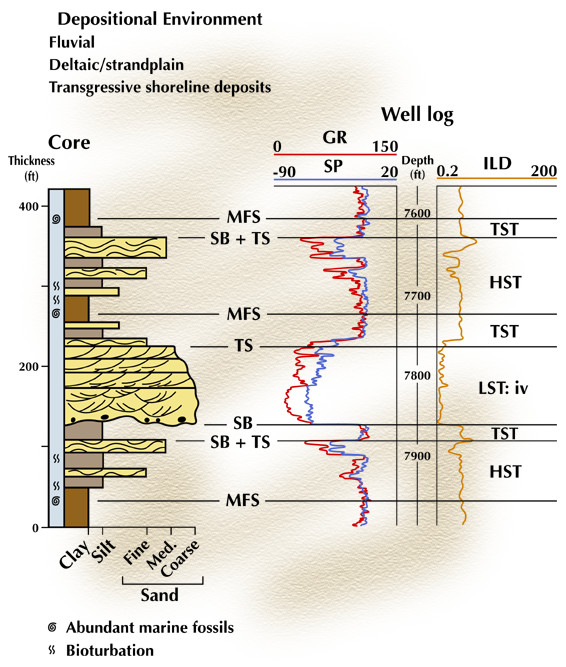
Figure 4. Core and well log data showing the relation among lithologic attributes, inferred depositional environments, and their expression on SP, GR, and ILD well log curves. Move the cursor over each of the three types of depositional environment to see that area highlighted on the core illustration. Outcrop photographs of the three systems tracts will appear in pop-up boxes when you click on the interval on the well log.