Estimating Permeability in Carbonates Using the Rock-Fabric Method
F. Jerry Lucia
Bureau of Economic Geology
| Design Objectives |
| Glossary |
| Credits |
| Back |
| Top |
| Exit |
 |
 |
|
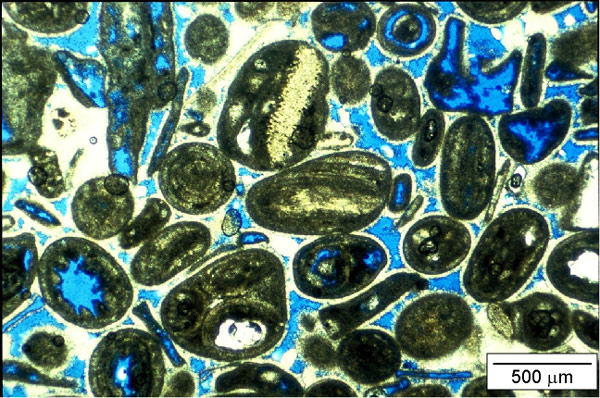
Example classification procedure for limestones: The exercise
is to estimate permeability from a thin section and measured total
porosity values. We will use photomicrographs of thin sections for
this exercise. The measured porosity of the core plug for this sample
is 20.1%. The value fpr TOTAL POROSITY will be entered in your worksheet. The first step is to classify the rock fabric and determine the petrophysical class. The lithology is given because it cannot be determined from the photo. In this example the lithology is limestone. The rock fabric is grainstone because the fabric is grain supported and no lime mud is present. Grainstones are petrophysical class 1. Both the ROCK FABRIC CLASSIFICATION and the PETROPHYSICAL CLASS will be entered into the approriate columns of your worksheet.
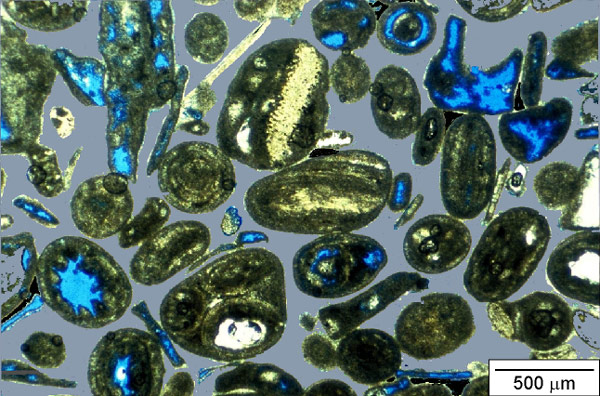
The second step is to identify the grains because pore space is classified according to its location relative to the grains. In this image only the grains are shown. They are approximately 500 microns in diameter and are relatively well sorted. Grains with concentric rings are ooids. Some grains are composite grains. You do not need to identify the grains.
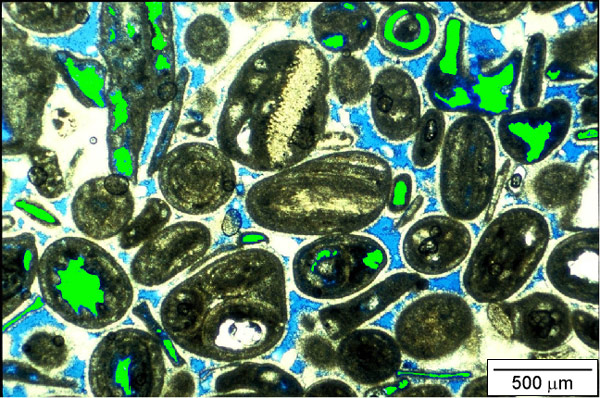
The third step is to look within the grains for pore space. Pore space within the grains is classified as separate-vug porosity and an accurate visible estimate of separate-vug porosity is needed to estimate the amount of interparticle porosity. In this example the separate-vug pore space is colored green and is estimated to be 5%. The value for SEPARATE VUG (Svug) POROSITY will be entered in your worksheet.
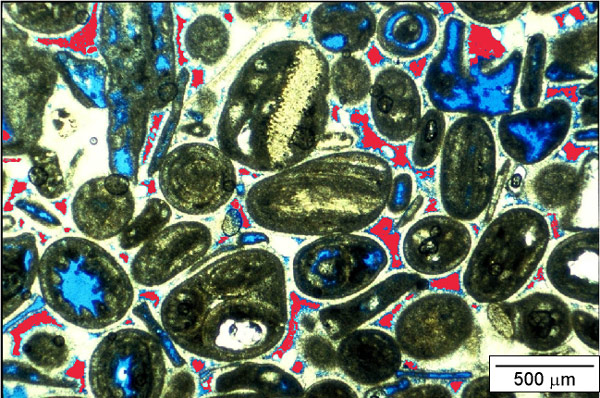
The fourth step is to look between the grains. In this example pore space (in red) and calcite cement (whitish color) is located between the grains. The red is interparticle porosity space. Although visible interparticle porosity can be estimated it will always be different than the total interparticle porosity because some of the pore space is too small to be seen in thin section. Therefore, the amount of interparticle porosity is determined by subtracting the visual estimate of separate-vug porosity from the measured total porosity. This value is automatically calculated in this exercise.
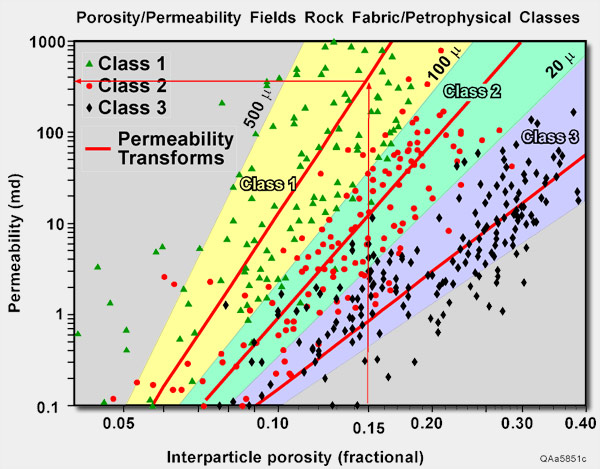
The fifth and
last step is to estimate permeability. This is done using the porosity
permeability chart. Enter the interparticle porosity value and go
up to the appropriate petrophysical-class transform and read the
permeability value. In this case, the interparticle porosity is
15 percent and the petrophysical class is 1. After you have completed the exercise we will provide you with the measured permeability values to compare with your answers. In this example, the measured permeability is 121 md.
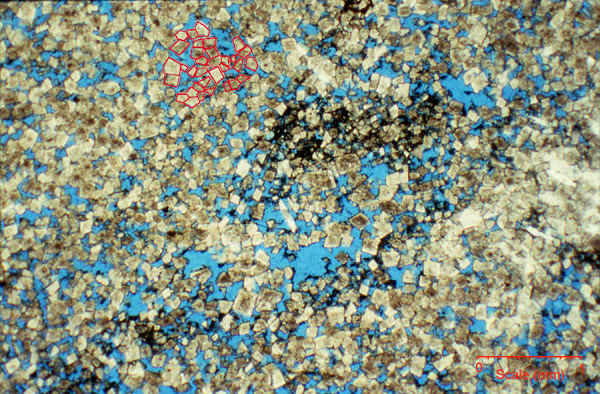
Example classification procedure for dolostones: The exercise is to estimate permeability from a thin section and measured total porosity values. We will use photomicrographs of thin sections for this exercise. The measured porosity of the core plug for this sample is 11.4%. The value for TOTAL POROSITY will then be entered in your worksheet.
The first step is to classify the rock fabric and determine the petrophysical class. The lithology is given because it cannot be determined from the photo. In this example the lithology is dolostone. The precursor limestone fabric is difficult to determine so we will call the fabric simply dolostone, or dolomudstone since not grains are visible. If a grainstone and grain-dominated packstone precursor fabric can be observed the classification procedure is the same as outlined in the limestone example. The petrophysical class is determined by the dolomite crystal size. The crystals are outlined in red is a small area. Using the scale, measure the crystal size. Larger crystals should be used for this measurement because the smaller crystals may be only the tip of the crystal. The crystal size is about 120 microns and the rock fabric is large crystalline dolostone. Large crystalline dolostones are class 1. You will then enter both the ROCK FABRIC CLASSIFICATION and the PETROPHYSICAL CLASS into your worksheet.
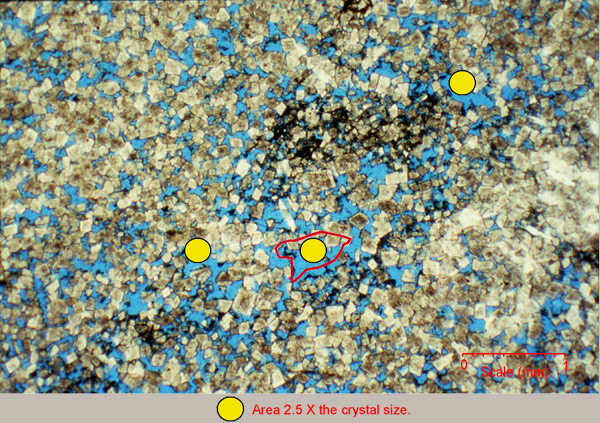
The second step is to identify separate-vug porosity. In this example the dolomite crystals are the particles and there is no pore space within the crystals. However, there are several pores that are larger than the crystals and could be classified as separate vugs. The rule is that only pores that are larger than 2.5 times the dolomite crystal size can be classified as separate vugs. A circle with a diameter of 2.5 times the crystal size is shown in yellow. Three pores are tested but only one is more than 2.5 times crystal size, and that pore is outlined in red and classified as a separate-vug. This vug by have formed by dissolution of an allochem, but there is too much alteration to tell. The volume of this vug, however, is less than 1 percent of the thin section and separate-vug porosity is considered to be zero. You will enter this value in your worksheet. The third step is to look between the crystals for intercrystal pore space. All the blue is intercrystal pore space except of the one separate vug outlined in red. Although visible intercrystal porosity can be estimated it will always be different than the total interparticle porosity because some of the pore space is too small to be seen in thin section. Therefore, the amount of interparticle porosity is determined by subtracting the visual estimate of separate-vug porosity from the measured total porosity. This result of this calculation will be entered in your worksheet.
The fourth and last step is to estimate permeability. This is done using the porosity permeability chart. Enter the interparticle porosity value and go up to the appropriate petrophysical-class transform and read the permeability value. In this case, the interparticle porosity is 11 percent and the petrophysical class is 1. Note that the interparticle porosity is given as a fraction rather than as a percent because fractional porosity is used in all engineering equations. Start on the x axis at 0.11, read up to the class 1 transform, over to the permeability on the y axis, and read the permeability. This is the estimated permeability; 29 md. This value will be entered in your worksheet. After you have completed the exercise we will provide you with the measured permeability values to compare with your answers. In this example, the measured permeability is 25.2 md.
|