Estimating Permeability in Carbonates Using the Rock-Fabric Method
F. Jerry Lucia
Bureau of Economic Geology
| Design Objectives |
| Glossary |
| Credits |
| Back |
| Top |
| Exit |
 |
 |
 |
Exercise: Estimating Permeability in Carbonates Using the Rock-Fabric Method
Before
beginning the exercise, carefully read the instructions
to understand both the exercise process and interface. Begin by
examining the exercise interface below. |
||||||||||||||
| THE EXERCISE INTERFACE: | ||||||||||||||
|
||||||||||||||
| DESCRIPTION OF THE INTERFACE TOOLS | ||||||||||||||
|
||||||||||||||
| THE EXERCISE PROCESS | ||||||||||||||
This exercise is organized as a series of 8 steps. Using the information presented earlier in this module, you should be able to work through each of the steps for each sample. The first 3 steps require simply entering the basic information given at the bottom of each sample image into the answer field. |
||||||||||||||
| STEP
1: note whether the sample is Limestone
or Dolostone. Click the appropriate radio button then click
the |
||||||||||||||
| STEP
2: note the Total Porosity indicated
on the sample image. Enter the value in the answer field, then click
the |
||||||||||||||
| STEP
3: note the Scale in microns as
indicated on the sample image. Enter the value in the answer field,
then click the |
||||||||||||||
| STEP
4: By examining the sample image, identify the grains
to determine both the Rock Fabric Description and
the Petrophysical Class. Use the information provided
in the info window to assist in your classification. Click on the
|
||||||||||||||
| STEP
5: Look within the grains to determine the Separate
Vug (Svug) porosity. This process will vary depending on
whether the sample is limestone or dolostone. If limestone, use
the point-counting tool to help determine the observed Svug porosity
(more). Enter the value in the answer field, then
click the |
||||||||||||||
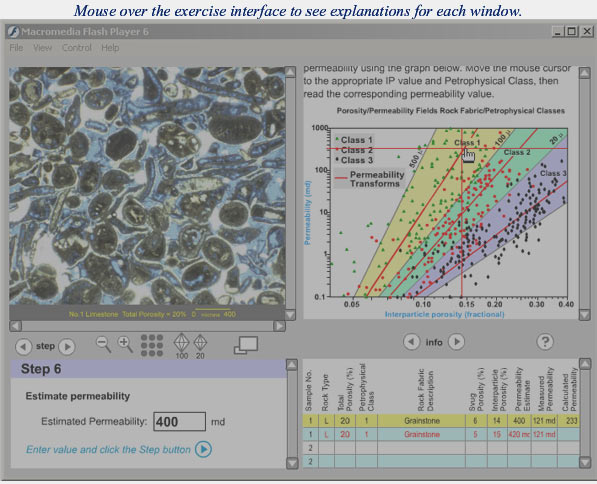
| STEP
6: In the answer chart, note the interparticle porosity
automatically calculated in the last step. Then, use that
value to to derive a Permeability Estimate. Use
the permeability estimation chart in the information window (see
graphic above) by placing the cursor cross-hair at the intersection
of the correct interpartical porosity value on the X-axis and the
corresponding Petrophysical Class transform (as entered in Step
4). Read the permeability estimate in millidarcies on the Y-axis.
Enter the value in the answer field, then click the |
||||||||||||||
STEP
7: click on the Validate button
to apply the appropriate numerical class transform in order to
validate the permeability estimate from the previous step. Read
the value in the "calculated permeability" column of
the answer chart. This step demonstrates the second of two appoaches
to arriving at a permeability estimate. then
click the |
||||||||||||||
| STEP
8: Click the Compare button to
compare your values with the answers provided by the author. Review
the similarities and differences. Then, click the |
||||||||||||||